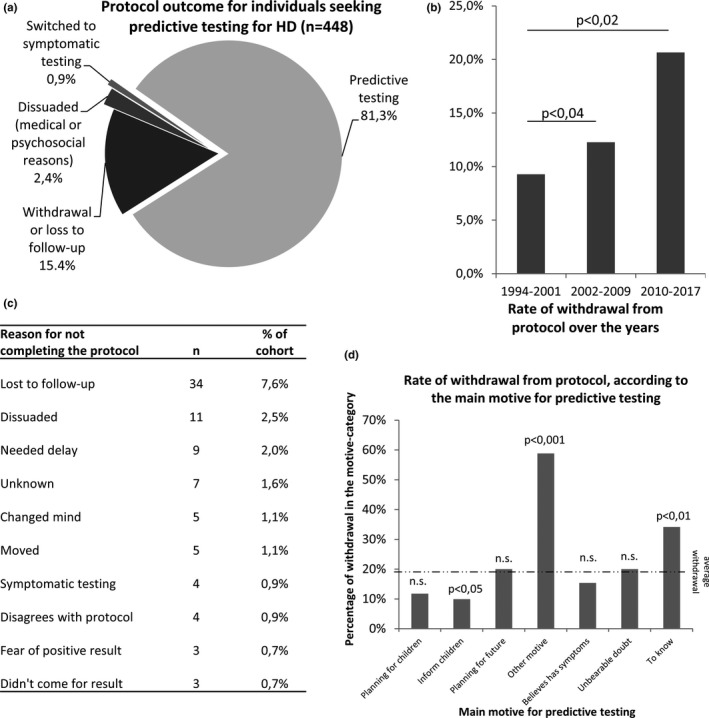
Figure 1.

Global outcomes of protocol and predictive testing in our cohort. (a) Protocol outcome for individuals seeking predictive testing for Huntington disease (n = 448). (b) Global rate of withdrawal from protocol, in three time‐periods of 8 years each. (c) Disclaimed or default (loss to follow‐up) reasons for not completing the protocol, listed from the most to the least frequent. (d) Rate of withdrawal from the predictive testing protocol according to the main motive for predictive testing. Dotted lines indicate the overall withdrawal rate in the cohort. Statistical significance is indicated above histograms as a p‐value, in (a) and (c). n.s. = not statistically significant
