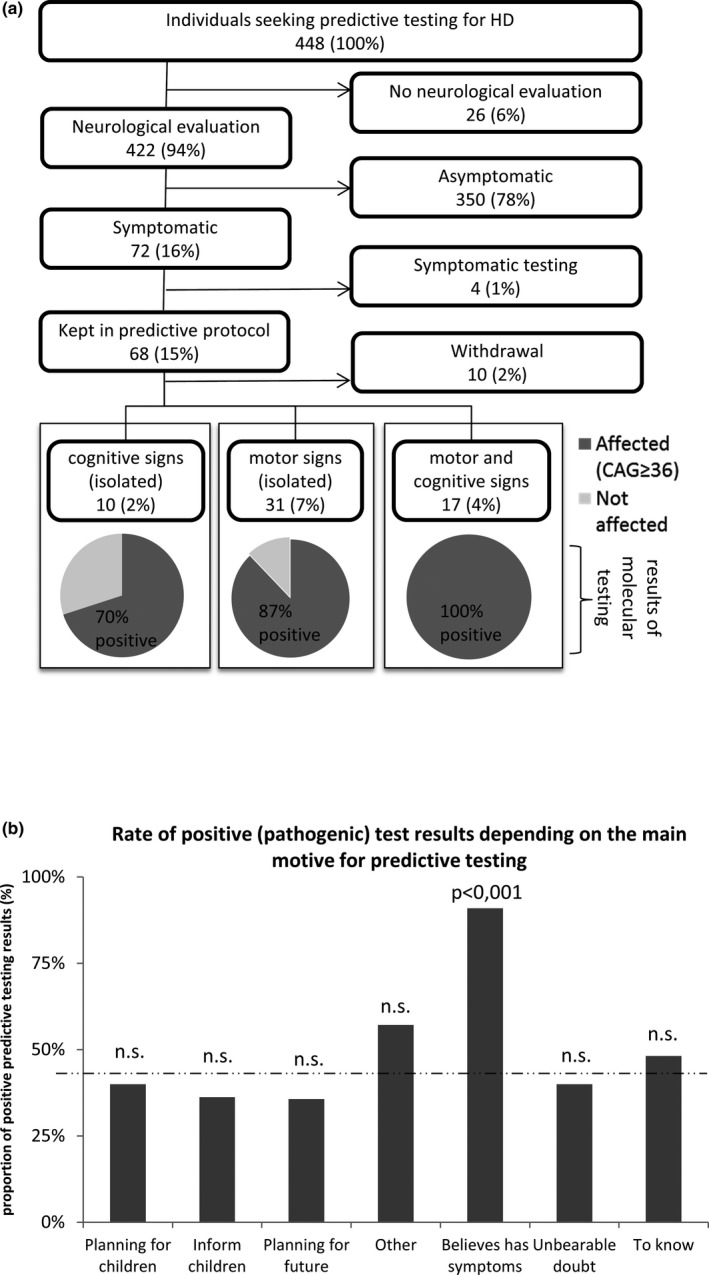
Figure 4.

Outcomes of predictive molecular testing for Huntington disease (HD), in suspected symptomatic patients. (a) Analytic flow‐chart of patients found symptomatic after examination by a trained neurologist (motor and cognitive signs compatible with the diagnosis of manifest HD). Number of individuals in each category is indicated in boxes, along with the absolute percentage of these individuals in the cohort. The bottom panel shows pie charts of the molecular results obtained after predictive testing, with dark gray and light gray areas corresponding to affected (pathogenic allele, ≥36 CAG repeats) and unaffected individuals, respectively. Percentages indicated on pie charts refer to the proportion of positive and negative results in each category of symptoms: isolated cognitive signs, isolated motor signs, and combined motor and cognitive signs. (B) Proportion of positive (i.e., pathogenic) results from predictive testing, depending on the main motive for testing. Statistical significance is indicated above histograms as a p‐value. n.s. = not statistically significant. Dotted lines indicate the overall mean value of y‐axis parameter
