. 2019 Aug 23;15(4):488–495. doi: 10.3988/jcn.2019.15.4.488

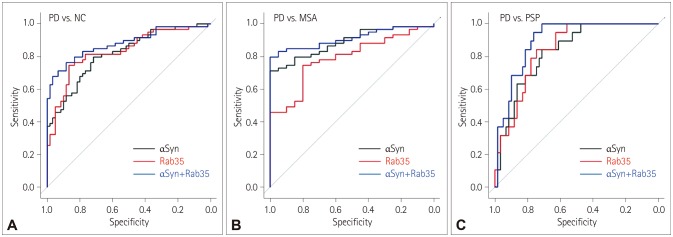
Fig. 3. The combined assessment of serum αSyn and Rab35 levels has a better accuracy in differentiating PD from NC and other parkinsonian disorders. ROC curves of serum αSyn (black line), serum Rab35 (red line), and combined assessment of serum αSyn and Rab35 (αSyn+Rab35, blue line) were examined in serum samples from NC and PD, MSA, and PSP patients. The AUCs for serum αSyn, serum Rab35, and the combined assessment of serum αSyn and Rab35 when comparing PD patients with NC were 0.8175 (95% CI=0.7429–0.8921), 0.8314 (95% CI=0.7569–0.9058), and 0.8794 (95% CI=0.8161–0.9427), respectively (A). The AUCs for serum αSyn, serum Rab35, and the combined assessment of serum αSyn and Rab35 when comparing PD and MSA patients were 0.8890 (95% CI=0.8191–0.9589), 0.7907 (95% CI=0.6870–0.8944), and 0.9110 (95% CI=0.8490–0.9731), respectively (B). The AUCs for serum αSyn, serum Rab35, and the combined assessment of serum αSyn and Rab35 when comparing PD and PSP patients were 0.8305 (95% CI=0.7362–0.9248), 0.8421 (95% CI=0.7548–0.9294), and 0.8983 (95% CI=0.8312–0.9655), respectively (C). αSyn: alpha-synuclein, AUC: area under the ROC curve, IMR: immunomagnetic reduction, MSA: multiple system atrophy, NC: normal controls, PD: Parkinson's disease, PSP: progressive supranuclear palsy, ROC: receiver operating characteristics.

Fig. 3