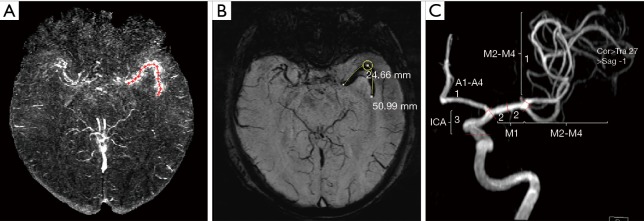
Figure 2.
The detailed measurements. (A) The region of interest (ROI) was drawn in the center along the thrombus, the susceptibility value of each point could be calculated directly by the SPIN software to obtain the average value and standard deviation of the susceptibility values in the ROI finally (Red+ represents ROI). (B) The length of thrombus was measured 3 times on the susceptibility-weighted imaging (SWI) MinIP images and the mean value of these was recorded. The corresponding score was deducted from the thrombus at the corresponding position. (C) ROI along the susceptibility vessel sign (SVS) on SWIM was drawn to calculate the repetition of susceptibility 3 times, and the mean value was recorded. Clot burden score (CBS) was graded by the following standard [5]: a score of 10 is normal; 3 points (as indicated) are subtracted for SVS found in the supraclinoid internal carotid artery (ICA); 2 points for SVS in each of the proximal and distal halves of the middle cerebral artery (MCA) trunk (M1); 1 point for SVS in the A1–A4 segment; and 2 points for SVS in the M2–M4 branches.

