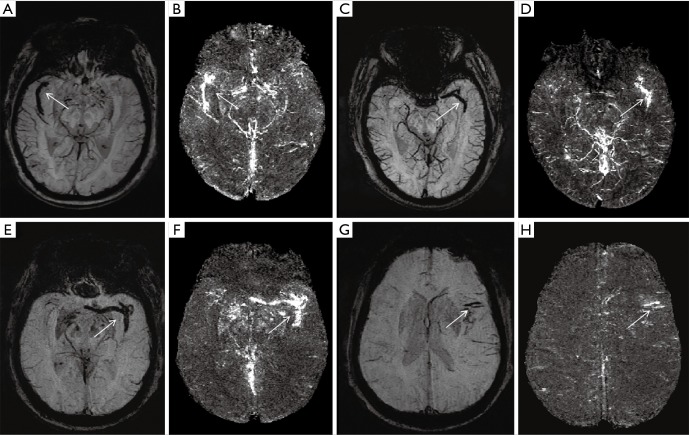
Figure 3.
The SWI and SWIM images of thrombi at different sites. (A,B) Female, 66 years old. susceptibility-weighted imaging (SWI) MinIP images shows low signal (white arrow in A) and susceptibility weighted imaging and mapping (SWIM) shows high signal (white arrow in B) thrombus in the right middle cerebral artery (MCA) (M2) with clot burden score (CBS) recorded as “9”; (C,D) Male, 57 years old. SWI MinIP shows low signal (white arrow in C) and SWIM shows high signal (white arrow in D) thrombus in the left MCA branch segment (M1, M2) with CBS recorded as “8”; (E,F,G,H) Male, 84 years old. SWI MinIP shows multiple low signal (white arrow in E,G) and SWIM shows high signal (white arrow in F,H) thrombi in the left MCA branches (M1, M2, M3), with CBS recorded as “4”.

