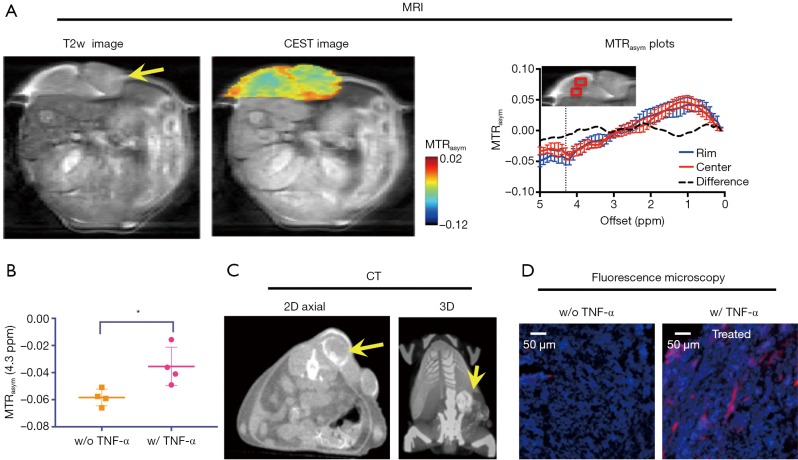
Figure 5.
CEST MRI and CT bimodal detection of the uptake and distribution of IX-lipo in TNF-α-treated CT26 tumors at 72 hours after injection. (A) From left to right: T2-weighted image, overlaid image showing the CEST map of the tumor (pointed by the arrow) at 72 hours after injection in a representative mouse that was treated with 1 µg TNF-α, and the mean MTRasym plots of two regions as indicated by the red boxes in the insert. (B) Comparison of the mean tumor CEST signal between TNF-α-treated and non-treated tumors (P=0.0258, unpaired two-tailed Student’s t-test, n=4). (C) Corresponding CT images of the same mouse, with the tumor indicated by arrows; (D) Fluorescence microscopic images showing the distribution of IX-lipo in the center of the tumor, with rhodamine-labeled IX-lipo shown in red and cell nuclei in blue (DAPI).

