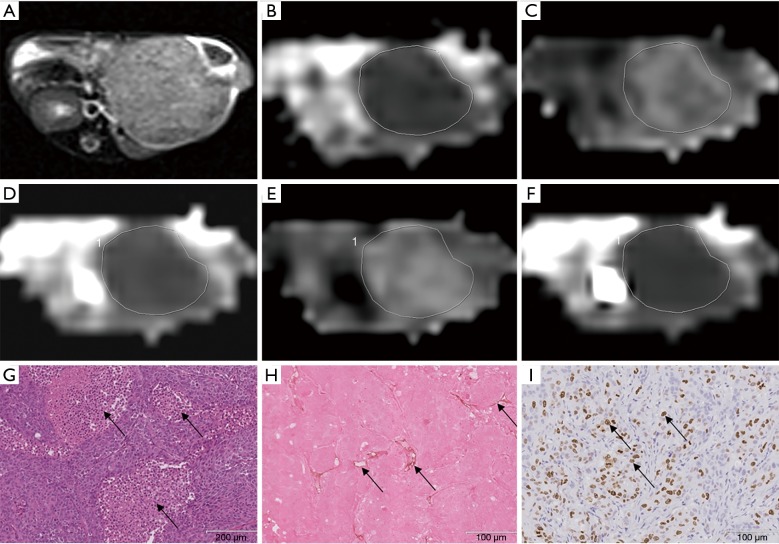
Figure 2.
DKI and SEM images and corresponding histopathological images of a hepatocellular carcinoma in the sorafenib induction group on the 21st day. (A) Transverse T2WI shows the greatest dimension of the tumor. (B) ADC map for ROI outlining the tumor. (C) MK map (MK =1.320). (D) MD map (MD =0.761×10⁻³ mm2/s). (E) α map (α=0.735). (F) DDC map (DDC =0.602×10⁻³ mm2/s). (G) Hematoxylin-eosin staining image shows patchy and irregular necrosis (black arrows, 10×) in the tumor. (H) Anti-CD31 immunohistochemistry image shows sparsely intratumoral micro-vessels (black arrows, 20×). (I) Anti-Ki-67 immunohistochemistry image shows heterogeneously stained Ki-67 positive cells (black arrows, 20×). DKI, diffusion kurtosis imaging; SEM, stretched exponential model; T2WI, T2-weighted imaging; ADC, apparent diffusion coefficient; ROI, region of interest; MK, mean kurtosis; MD, mean diffusivity; DDC, distributed diffusion coefficient.

