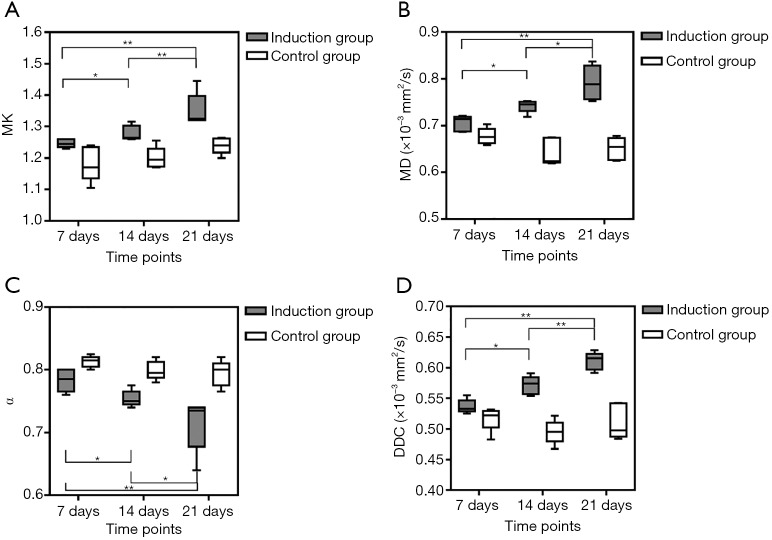
Figure 4.
Sequential comparisons of DKI and SEM parameters of HCC in the sorafenib induction group and control group at different time points. Box-plots show sequential changes of MK (A), MD (B), α (C), and DDC (D) in these two groups. All parameters were tested with Mann-Whitney U-test (*P<0.05, **P<0.01). Center line = median; upper and lower margins of box = upper and lower quartiles. DKI, diffusion kurtosis imaging; SEM, stretched exponential model; HCC, hepatocellular carcinoma; MK, mean kurtosis; MD, mean diffusivity; DDC, distributed diffusion coefficient.

