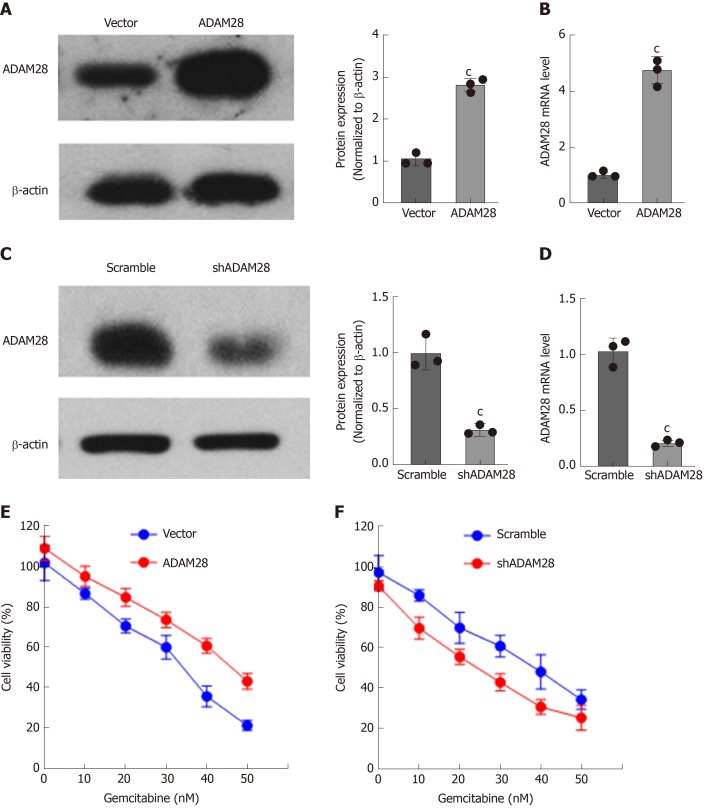
Figure 5.
Effect of ADAM28 on cell viability inhibition by gemcitabine. A: Western blot analysis of overexpression of ADAM28 in SW1990 cells. The right panel is the semi-quantitative result for ADAM28 protein expression. cP < 0.001 vs vector group; B: The mRNA expression of ADAM28 in ADAM28 overexpressing and vector control cells. cP < 0.001 vs vector group; C: Western blot analysis of ADAM28 protein in SW1990 cells treated with shRNA against ADAM28 and scramble control. The right panel is the semi-quantitative result for ADAM28 protein. cP < 0.001 vs scramble group; D: The mRNA expression of ADAM28 in ADAM28 knock-down and scramble control cells. cP < 0.001 vs scramble group; E: Relative cell viability evaluated according to absorbance value in ADAM28 overexpressing and vector control SW1990 cells treated with gemcitabine. cP < 0.001 vs vector group; F: Cell viability of ADAM28 knock-down and scramble SW1990 cells treated with different doses of gemcitabine for 24h. cP < 0.001 vs scramble group. shADAM28: shRNA against ADAM28; Scramble: Knockdown control.

