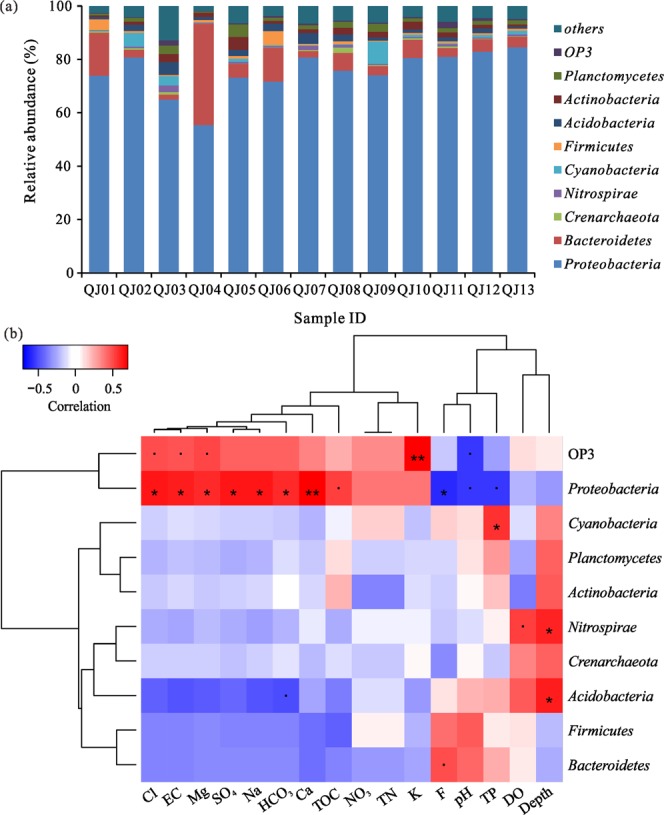
Figure 2.

Microbial community composition at phylum level in the study area. (a) Taxonomic classification of bacterial reads retrieved from different groundwater samples at the phylum level using the RDP classifier. “others” indicates phyla with relative abundances of less than 1.0%; (b) Heat map of correlation between the ten most abundant bacterial phyla and hydrochemical factors. Significance codes: 0 < p < 0.001 “***”, 0.001 < p < 0.01 “**”, 0.01 < p < 0.05 “*”, 0.05 < p < 0.1 “•”.
