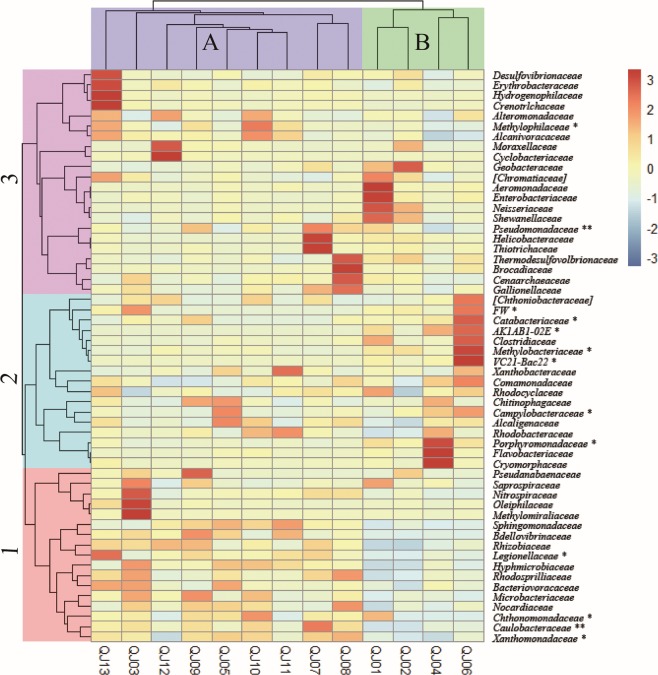
Figure 3.
Heat map of log relative abundances of the distribution of dominant family in the three samples. The double hierarchical dendrogram shows the microbial distribution of the 13 samples. The log relative abundance for the microbial families are depicted by the color intensity; the color key is at the topright. The microbial families with * at their right are related with fluoride concentration analyzed through SPASS software, denoted **(p < 0.01) and *(p < 0.05).

