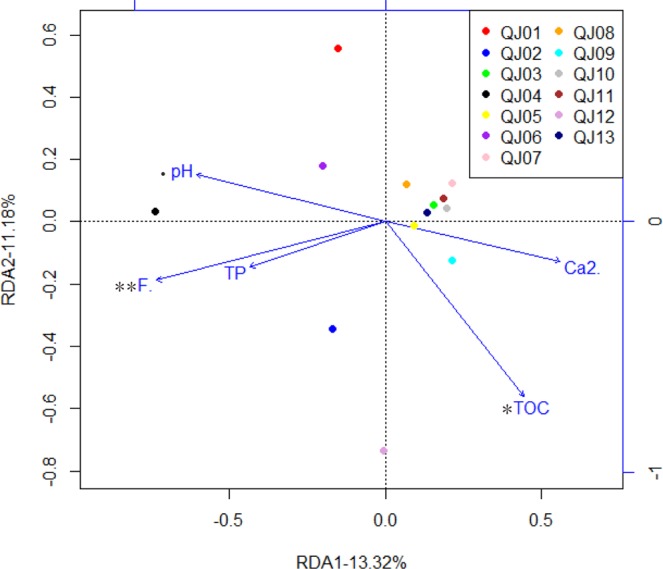
Figure 5.

RDA biplot of bacterial community composition and the five most significant geochemical parameters. Each dot represents one sample. Arrows indicate the direction and magnitude of geochemical parameters associated with bacterial community structures. Total variance is 0.027, and eigenvalues for constrained axes, RDA1 and RDA2, are 0.0036 and 0.0030, respectively. The significant vectors in the figure were highlighted to avoid misunderstanding. Significance codes: 0 < p < 0.001 “***”, 0.001 < p < 0.01 “**”, 0.01 < p < 0.05 “*”, 0.05 < p < 0.1 “•”.
