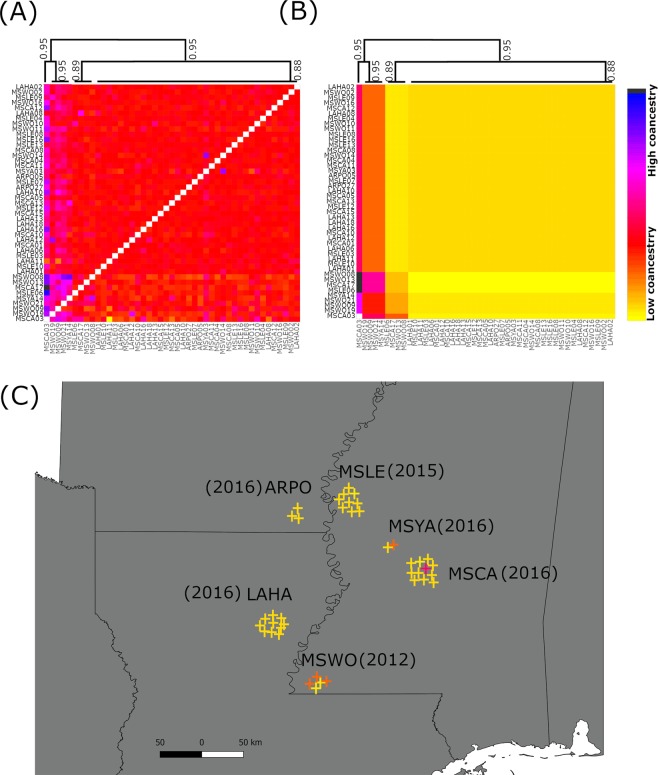
Figure 4.
U.S. population structure according to fineRADstructure. (A) Coancestry matrix and population average matrix (B) were constructed based on six sample locations from three different crop seasons (2012, 2015, 2016). The collection performed in 2015 was remove from the analysis due to high levels of missing data. The different colors indicate different degrees of coancestry and the trees show putative relation between individuals based on shared coancestry. (C) Structure at fine scale based on fineRADstructure results. Crosses represent a single sample colored according to the prevalent coancestry relation with other samples found in (B).

