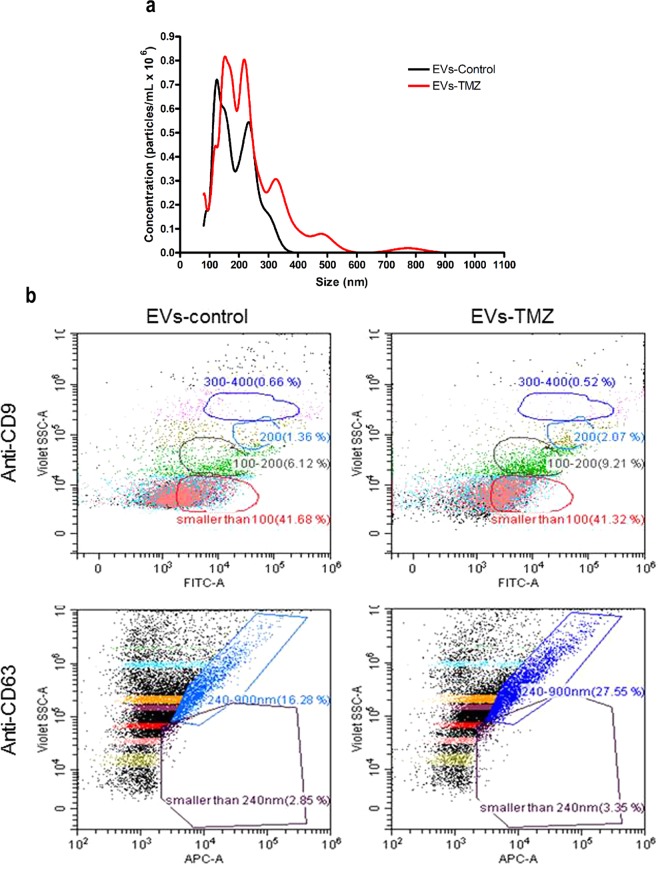
Figure 2.
Characterization of EVs secreted by melanoma cells in response to TMZ. (a) A representative NTA showing the size and concentration distribution of EVs secreted by SKMel 37 human melanoma cells treated or not with TMZ. Each curve was generated from three measurements. The mean ± SD for control was 189 nm ± 14.7 and 237 nm ± 11.7 for TMZ-treated cells (p = 0.0116 by unpaired t test, two-tailed). (b) Dot plots of EVs from SKMel 37 cells showing the presence of the vesicle protein marker CD9 and CD63. The percentages of CD9 and CD63 positive events are shown inside the gates. Each gate represents a specific vesicle size range (<100 nm, 100–200 nm, 200 nm, 300–400 nm).

