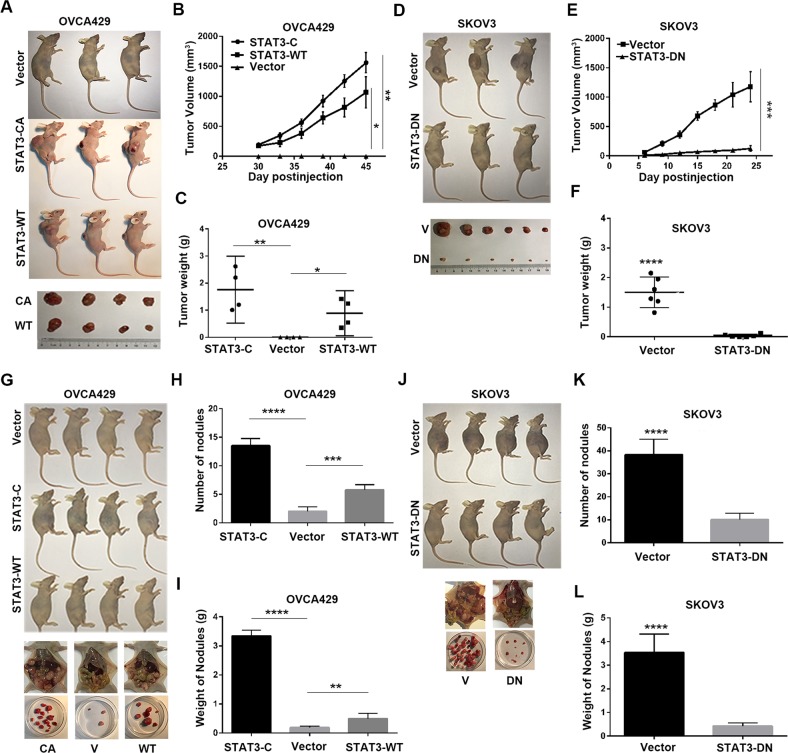
Fig. 5. Xenograft tumor growth in mice.
a–c Representative subcutaneous tumors, growth curves, and tumor weights induced by OVCA429 cells expressing vector, STAT3-CA and STAT3-WT. d–f Representative subcutaneous tumors, growth curves, and tumor weights induced by SKOV3 cells expressing vector and STAT3-DN. g–i Representative intraperitoneal tumor and nodules, nodule number, and nodule weights induced by OVCA429 cells expressing vector, STAT3-CA and STAT3-WT. j–l Representative intraperitoneal tumor and nodules, nodule number, and nodule weights induced by SKOV3 cells expressing vector and STAT3-DN. Error bars = 95% CIs. n = 6 mice/group. Arrows indicate metastatic nodules. ***P < 0.001, ****P < 0.0001 vs controls

