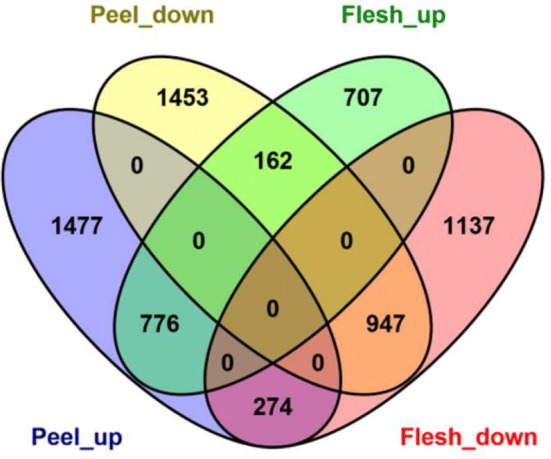
Fig. 2.

Venn diagram analyses of the differentially expressed genes that were identified in this study. Peel_up: FPKM values were highest in the peel at 9 days-post pollination (dpp), but lowest at 3 dpp; Peel_down: FPKM values were highest in the peel at 3 dpp, but lowest at 9 dpp; Flesh_up: FPKM values were highest in the flesh at 9 dpp, but lowest at 3 dpp; Flesh_down: FPKM values were highest in the flesh at 3 dpp, but lowest at 9 dpp
