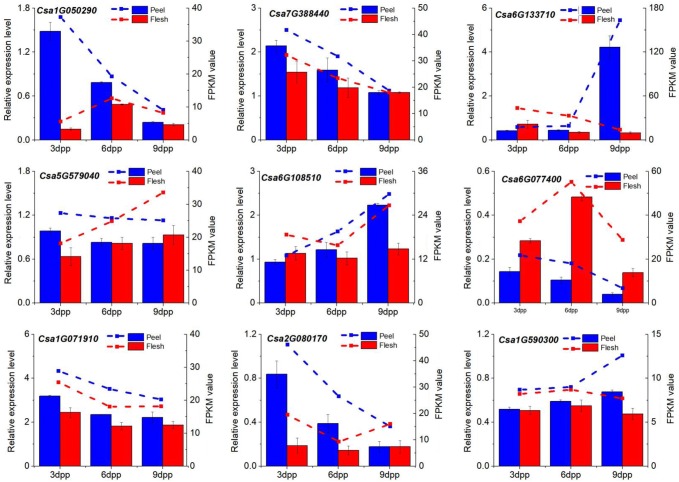
Fig. 4.
Comparison of quantitative real-time reverse transcription-PCR (qPCR) analyses of selected genes (left y-axis, histograms) and fragments per kilobase of exon model per million mapped reads (FPKM) values as assessed by RNA-seq (right y-axis, dotted lines). The cucumber β-actin gene (GenBank AB010922) was used as an internal control to normalize the expression data. Each value denotes the mean relative level of expression of three biological replicates

