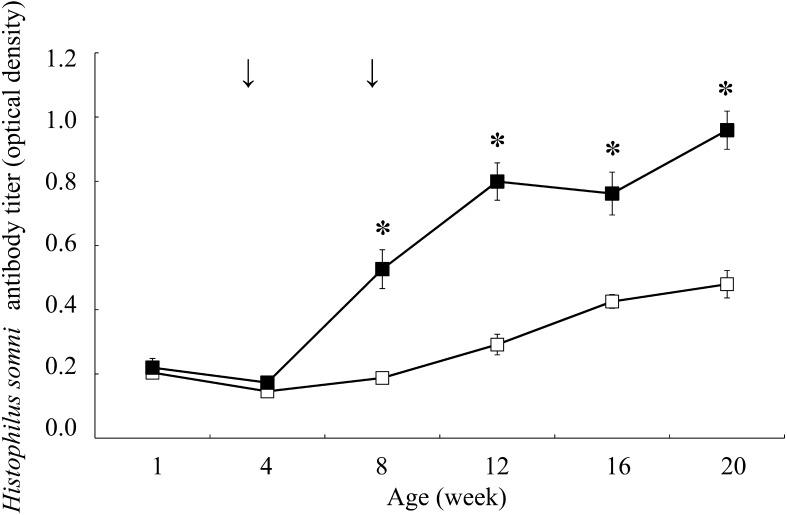
Fig. 3.
Changes in antibody titers against Histophilus somni in the vaccination (n=18, dark square) and control (n=18, empty square) groups. Antibody titers (optical density) are expressed as mean ± standard error. Arrows indicate inoculation with combined vaccine containing inactivated Pasteurella multocida, Mannheimia haemolytica, and Histophilus somni. The asterisk indicates a significant difference between groups at the same age (*P<0.05).

