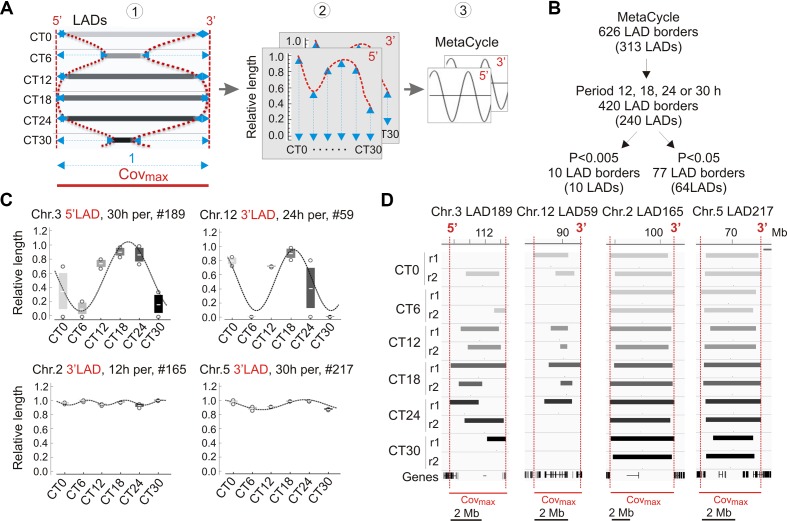
Figure 4.
Analysis of periodicity in genome coverage by LADs. (A) Approach to the identification of periodic LADs. (1) A variable LAD area is identified, for each LAD, across CTs and replicates (not shown here for clarity); the maximal merged area of these LADs is defined as Covmax and distances from the 5′ and 3′ end of each LAD to the Covmax limits are measured (blue arrows); (2) relative lengths are calculated at both the 5′ and 3′ end of LADs (1 = Covmax length; 0 = no LAD); (3) MetaCycle is applied to identify periods at the 5′ and 3′ ends of LADs. (B) Identification of periodic LADs using MetaCycle. (C) Examples of periodic oscillations (P < 0.005; MetaCycle Fisher’s exact test) in LAD 5′ and 3′ length during the circadian cycle among the 10 LADs identified by MetaCycle (see also Table 1 ); mean ± SD, individual data points and MetaCycle best-fit cosine curves are shown. (D) Genome browser views of periodic LADs shown in (C). Red lines delimit Covmax and the 5′/3′ numbering denotes the periodic LAD border shown in (C).

