Figure 5.
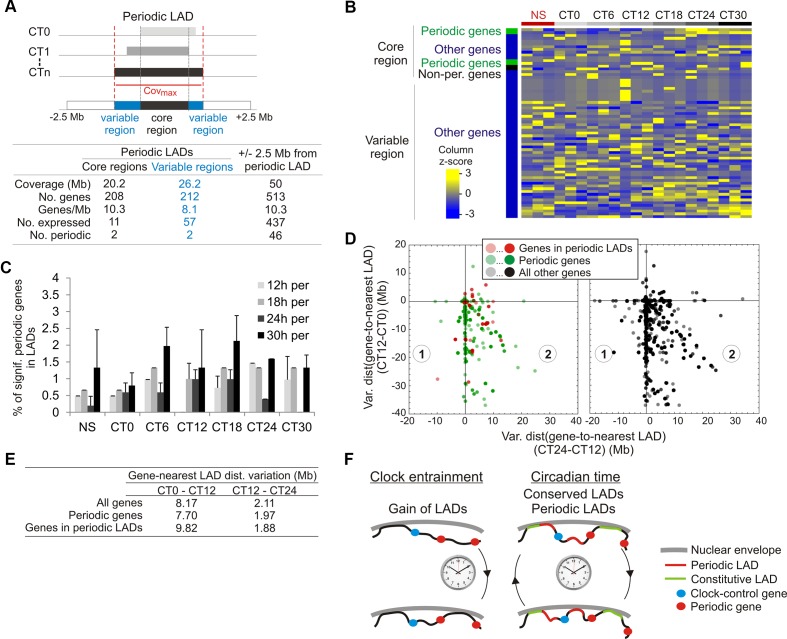
Genes in or near periodic LADs do not display periodic expression. (A) Representation and gene statistics of the core and variable regions of the significantly periodic LADs. (B) Gene expression z-score of expressed genes (n = 63) localized in significantly periodic LADs, for each CT and replicate (n = 3). Genes are sorted by groups (indicated on the left) and within groups, by phase. (C) Percentages of significantly periodic genes (P < 0.005, MetaCycle Fisher’s exact test) found in LADs at each CT. (D) Scatter plots of variations in gene-to-nearest LAD distances between CT0 and CT12 (y axis) and between CT12 and CT24 (x axis). One data-point represents a single gene or multiple genes at a particular coordinate on the graph, with color intensity reflecting the number of genes at that point. (E) Mean gene-to-nearest LAD distance variation. (F) Summary and model of oscillatory LAD patterns after entrainment of the circadian clock. Entrainment of the clock is accompanied by a net gain of LMNB1 LADs (bottom). During circadian time, most LADs are conserved (constitutive LADs) while a small number is periodic. Typical genomic positions of clock-control genes and periodic genes relative to these LADs are shown.

