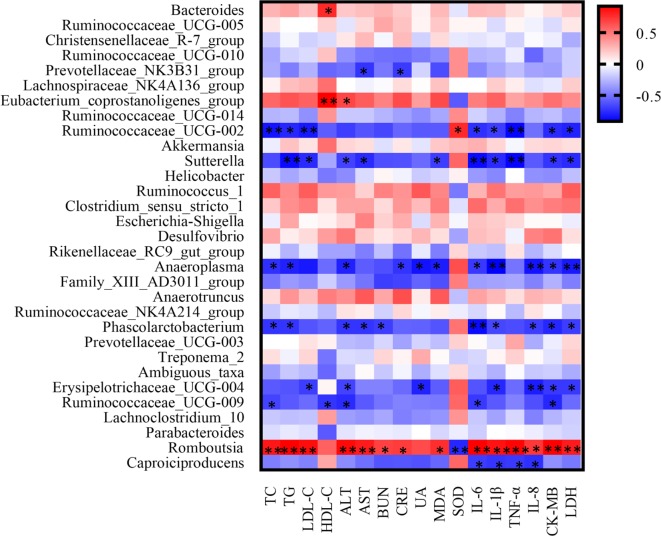
Figure 11.
The correlation heatmap of identifying associations between the gut microbiota structure (genus level) and the pathological indexes. The red color means positive correlation while the blue color shows a negative correlation. The deeper color means the greater correlation (p < 0.05*, p < 0.01**).

