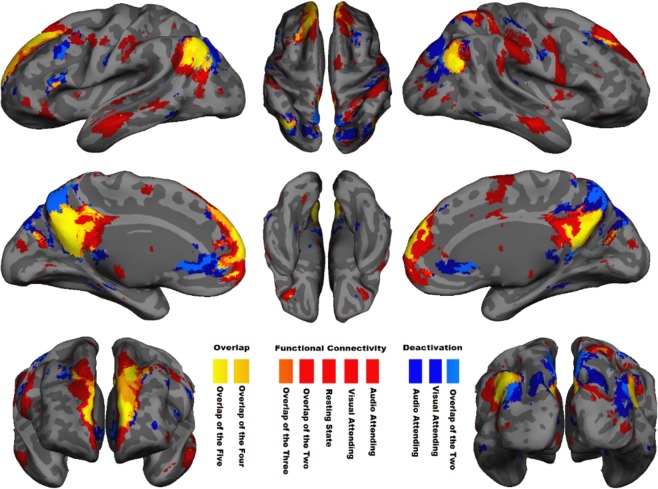
Figure 2.
Spatial overlap between regions with significant negative BOLD response and functional connectivity in DMN. Voxel-wise significant z statistics are mapped onto a semi-inflated cortical surface for better visualization (slice-based mapping can be found in Fig. S1). Dark blue denotes the spatial extent of the regions with significant (z < −4 after multiple comparisons correction) NBR to visual- and audio-attended stimuli during two separate tb-fMRI scans. Light blue indicates their overlap. Red indicates the spatial extent of the regions with significant functional connectivity (z > 4 after multiple comparisons correction) extracted from two tb-fMRI scans (visual-attended and audio-attended tasks) as well as one rs-fMRI scan. Light red and orange highlight the overlap of the two and three functional connectivity networks, respectively. Dark-yellow and yellow indicate the overlap of four and all five of the aforementioned networks, respectively. See Fig. S2 for individually depicted and detailed spatial pattern of each functional connectivity network and task-related BOLD response illustrated in this figure.

