
Figure 1.
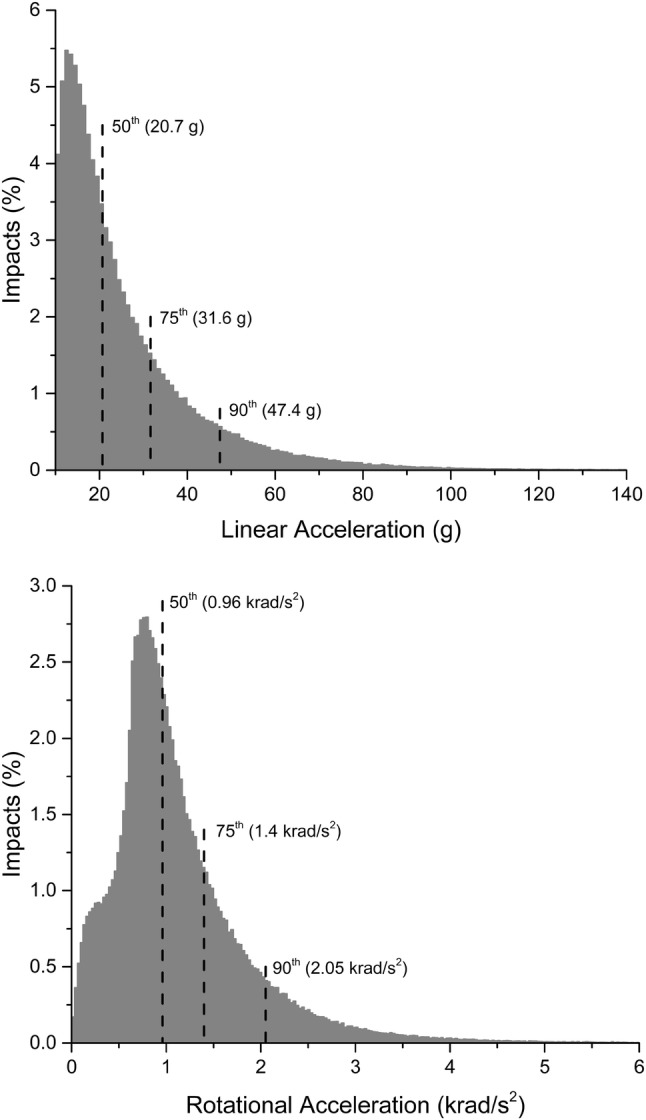
Histogram representations of the distribution of peak linear (top) and rotational (bottom) acceleration for all head impacts recorded in the 454 non-concussed athletes enrolled in this study.
Official websites use .gov
A
.gov website belongs to an official
government organization in the United States.
Secure .gov websites use HTTPS
A lock (
) or https:// means you've safely
connected to the .gov website. Share sensitive
information only on official, secure websites.
Histogram representations of the distribution of peak linear (top) and rotational (bottom) acceleration for all head impacts recorded in the 454 non-concussed athletes enrolled in this study.