
Figure 2.
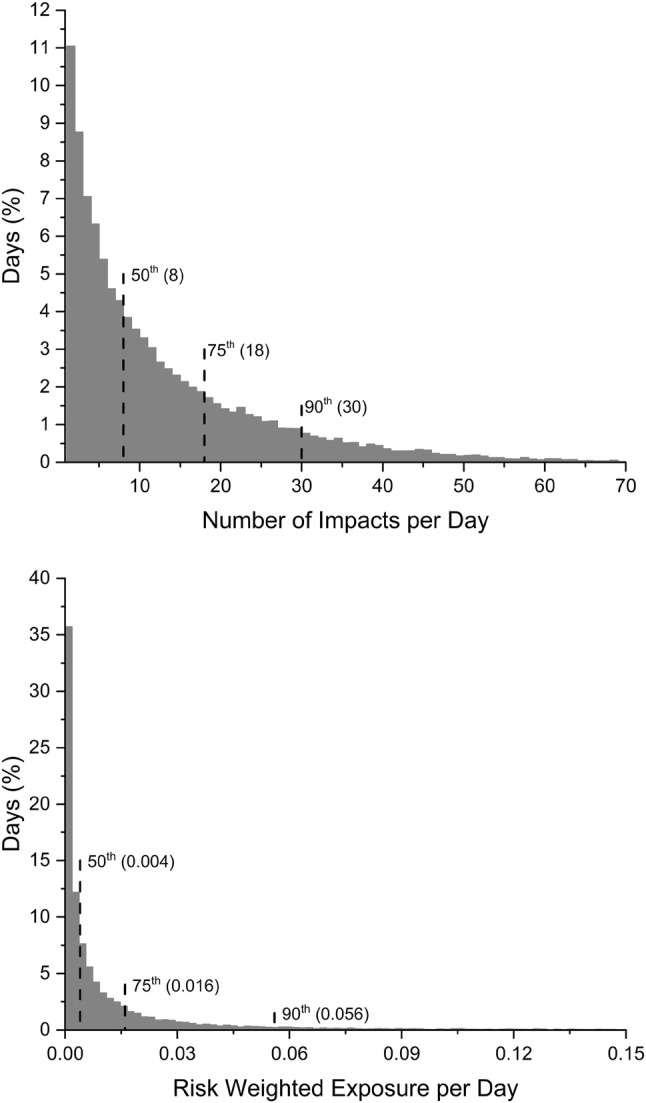
Histograms of distribution of number of head impacts per day and risk weighted exposure (RWE) per day. Data are presented for the non-concussed population (n = 454). 50th, 75th, and 90th percentile values are presented in parentheses.
Official websites use .gov
A
.gov website belongs to an official
government organization in the United States.
Secure .gov websites use HTTPS
A lock (
) or https:// means you've safely
connected to the .gov website. Share sensitive
information only on official, secure websites.
Histograms of distribution of number of head impacts per day and risk weighted exposure (RWE) per day. Data are presented for the non-concussed population (n = 454). 50th, 75th, and 90th percentile values are presented in parentheses.