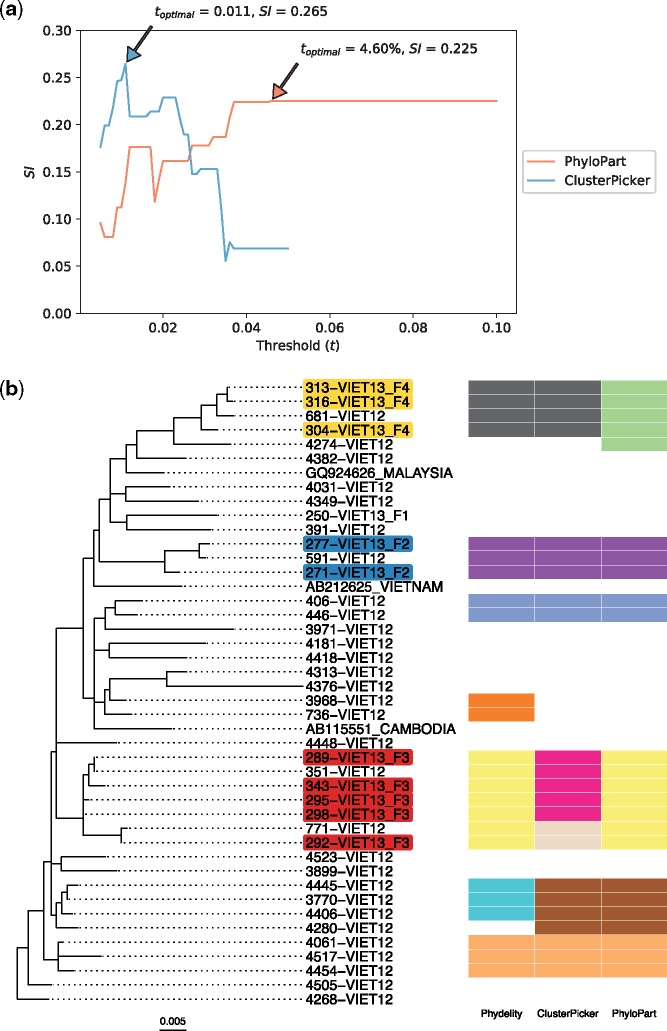
Figure 3.
Clustering results of hepatitis B viruses (HBV) collected from residents in the Binh Thuan Province of Vietnam. (a) Plots of mean Silhouette index (SI) computed for the range of genetic distance thresholds implemented in ClusterPicker and PhyloPart. Clustering results from the lowest optimal distance threshold () with the highest SI value for each method were compared with Phydelity as depicted in (b) (ClusterPicker: = 0.011 nucleotide/site, SI = 0.265; PhyloPart: = 4.60%, SI = 0.225). Plot for ClusterPicker is truncated at ∼0.05 nucleotide/site as the entire tree collapsed to a single cluster after this threshold. (b) Maximum likelihood phylogeny of HBV polymerase sequences derived from viruses collected from forty-one patients. Twelve patients were confirmed to be members of three separate family households (F2, F3 and F4; tip names shaded with a distinct colour for each family). Clustering results from Phydelity are depicted as a heatmap alongside outputs from ClusterPicker and PhyloPart based on their respective . Each distinct colour of the heatmap cells denotes a different cluster.

