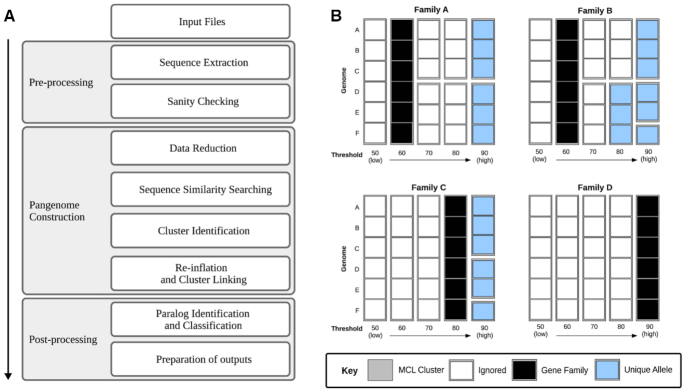
Figure 1.
(A) Flow chart denoting a simplified workflow. (B) Example cluster classification. Blocks represent sequences from unique genomes. Grey blocks represent MCL clusters at various percentage identity cut-offs. Black squares indicate a “gene family” cluster, the lowest percentage identity threshold from the MCL clustering. Blue squares represent “unique alleles,” MCL clusters at higher percentage identity thresholds with unique combinations of sequences (at the higher threshold at which they are observed together). White squares represent redundant MCL clusters; these are not present in the PIRATE output.

