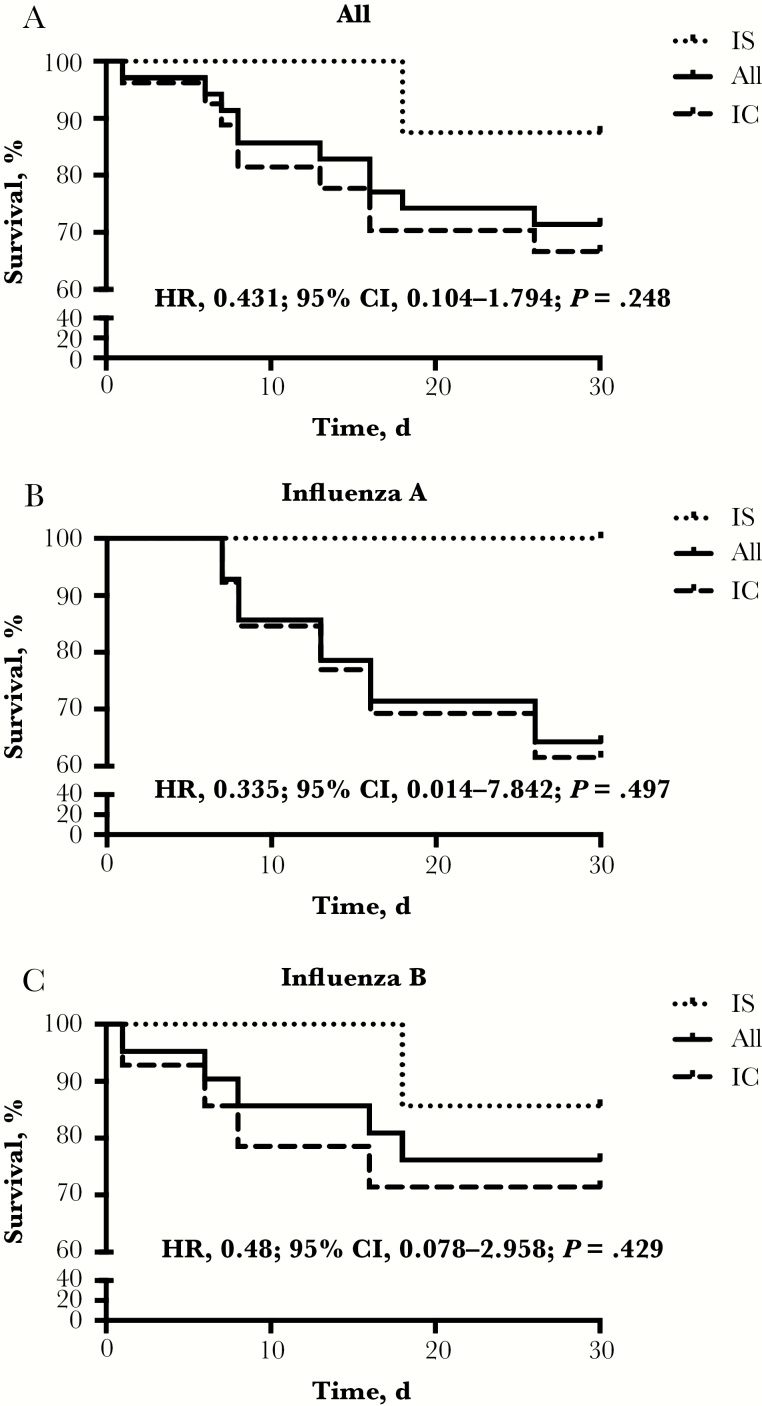
Figure 4.
Intensive care unit (ICU) survival. Kaplan-Meier graphs showing the 30-day ICU survival course in the overall cohort (A), as well as in influenza A patients (B) and B patients (C) only. Compared are immunosuppressed patients with immunocompetent
patients. Abbreviations: CI, confidence interval; HR, hazard ratio; IC, immunocompetent; IS, immunosuppressed.

