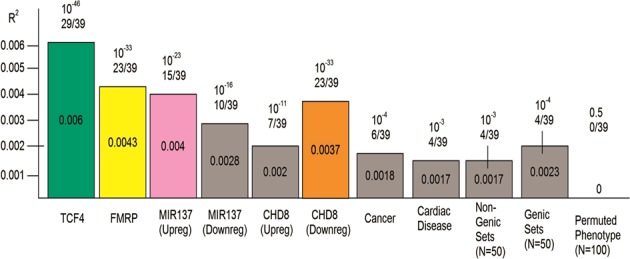
Fig. 3.

R2 and p-values from meta-analysis of all gene sets. Numbers on top of the bars denote the meta-analysed Stouffer’s Z p-value for the gene set and the number of polygenic scores that were significant in independent, held-out test studies. For the genic and non-genic sets, the statistics represent the median of 50 sets; the line above the box represents the range of these sets for the 50 iterations of each. The final box is the median results for 100 permuted phenotype iterations
