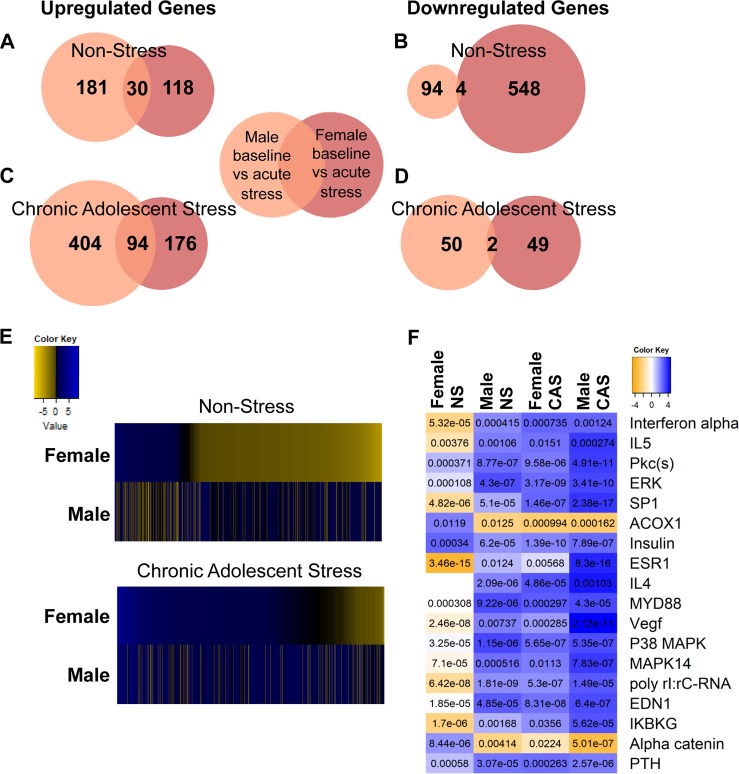
Fig. 4.
Paired comparison of gene expression between acute stress and baseline time points was assessed within sex and adolescent stress history group (non-stress (NS) and chronic adolescent stress (CAS)). Differentially expressed genes (DEGs) were split into up- and downregulated genes in animals without a history of CAS exposure (a, b) and those with prior CAS exposure (c, d) and shown in Venn diagrams. e Heatmaps show direction of gene expression change using log2(fold change (FC)) following acute stressor exposure in male and female rats with a history of CAS or NS control conditions. Genes that were significantly up- or downregulated in either males or females were included in heatmaps. Fisher’s exact test of overlap shows that upregulated genes in NS males and females significantly overlap (p = 4E−28) but downregulated genes do not (p > 0.05). In animals with a history of CAS, both upregulated (p = 2.3e-76) and downregulated (p = 0.011) genes significantly overlap between males and females. f Qiagen Ingenuity Pathway Analysis (IPA) upstream analysis was used to assess upstream regulators of transcriptional changes. The heatmap represents the activation z-score in each cell. The p value of overlap between significant DEGs in each paired comparison (acute stress vs baseline) and genes known to be regulated by each upstream regulator are notated within each cell; α = 0.01 for IPA Upstream Analyses

