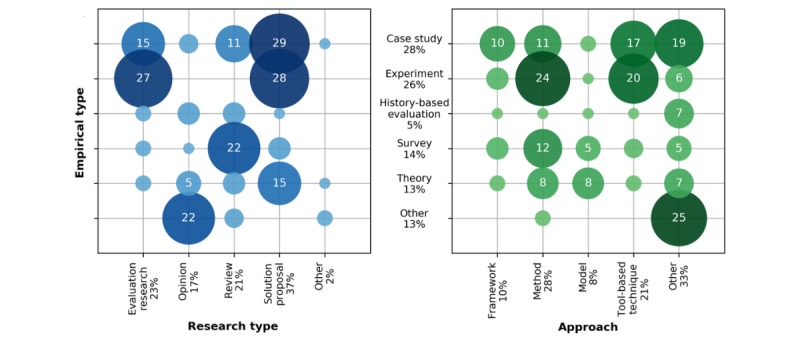
Figure 4.

Bubble graphs associating the empirical types with the research types (left) and the approaches (right) of the included connected health studies. The vertical axis (empirical type) is shared between the two graphs. The size and shade of each bubble represents the absolute frequency of connected health papers belonging to a given pair of empirical type and research type (left) or approach (right); absolute frequencies less than 5 are not typed inside the bubble because of space limitations. The horizontal and vertical axes labels are accompanied by the relative frequency (ie, percentage) of the class.
