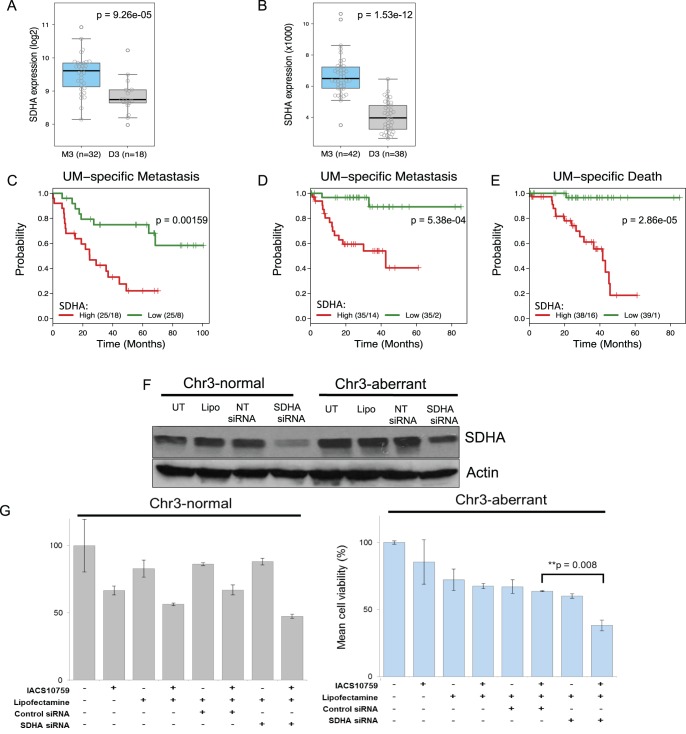
Figure 4.
Monosomy 3 UM tumors display a heightened gene expression of specific ETC complex II genes. (A) SDHA gene expression in M3 (n = 32) versus D3 (n = 18) UM tumors.20 SDHA expression was significantly higher in M3 than in D3 UM tumors (P = 9.3·10−5, Kruskal-Wallis test). Box plots show median values and the 25th to 75th percentile range in the data (i.e., the IQR). Whiskers extend 1.5 times the IQR. Circles show all data values. (B) SDHA gene expression of M3 (n = 42) versus D3 (n = 38) UM tumors from UM TCGA data. SDHA expression (normalized RSEM mRNA expression) was significantly higher in M3 tumors than in D3 tumors (P = 1.5·10−12, Kruskal-Wallis test). (C–E) Kaplan-Meier analyses with log-rank tests for SDHA expression groups that were above and below the median. For each graph, numbers give the cases and events in each group. UM-specific metastasis for (C), Laurent cohort (n = 50), (D) UM TCGA cohort (n = 70). (E) UM-specific death for the UM TCGA cohort (n = 77). (F) Western blot analysis showing successful knockdown of SDHA protein resulting from SDHA siRNA transfection in both the Chr3-aberrant cell line Mel20–06–039 and the Chr3-normal Mel202 cell line. UT, untransfected; Lipo, lipofectamine-treated; NT, nontargeting. (H) Restoration of OxPhos inhibitor IACS-010759 sensitivity in Chr3-aberrant UM cells by SDHA knockdown. Right: siRNA-based knockdown of SDHA in cell line Mel20–06–039 (M3). Left: Mel202 cells (D3).

