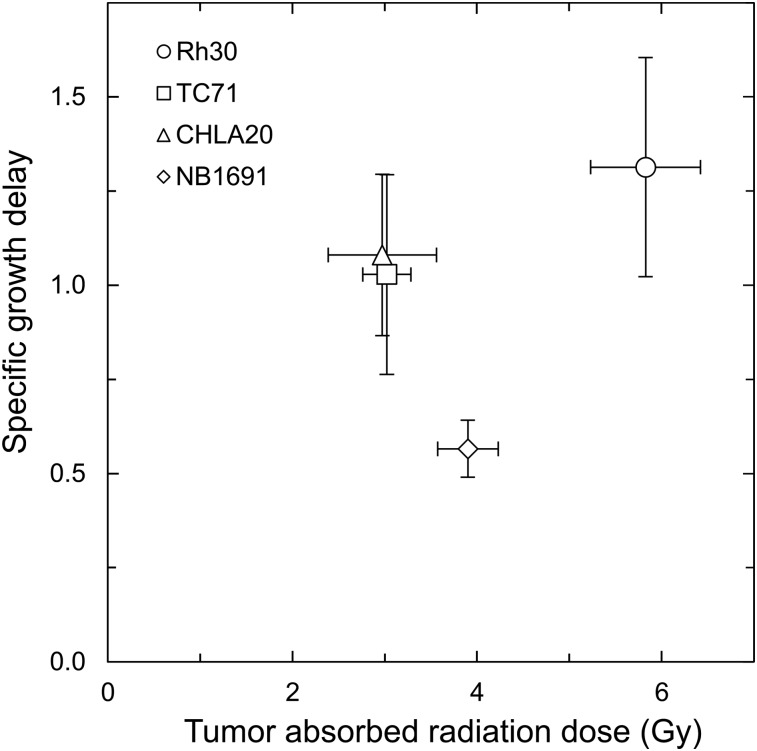
FIGURE 4.
Dose–response relations for mice with Rh30, TC71, CHLA20, and NB1691 xenografts and treated with single dose of CLR 131 MRT. Integral absorbed doses (x-axis) were calculated after 3 half-lives (24 d) after injection for each subject. Tumor growth response is expressed on vertical axis as mean specific growth delay for Rh30, TC71, CHLA20, and NB1691 (n = 7, 7, 6, and 9, respectively) with error bars for SE.

