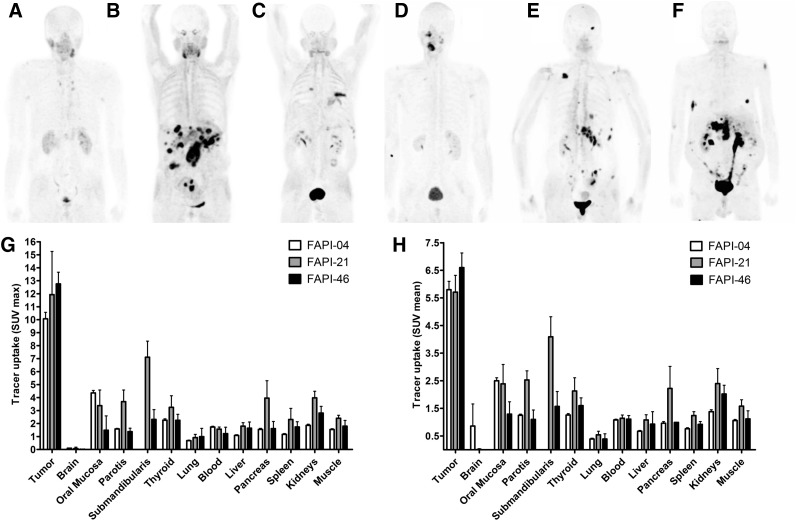
FIGURE 6.
Whole-body PET/CT imaging of tumor patients. (A–F) Maximum-intensity projections 1 h after intravenous administration of 68Ga-labeled FAPI-21 (A–C) and FAPI-46 (D–F). (G and H) Maximum (G) and mean (H) tracer uptake of 68Ga-labeled FAPI-21 and -46 in tumor and healthy organs as compared with FAPI-04 (n = 2–25) (Supplemental Table 4).

