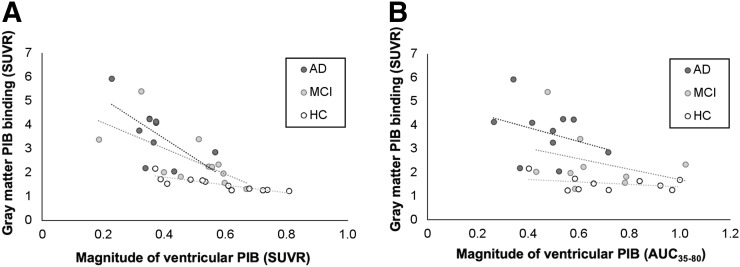
FIGURE 4.
Correlations between gray matter 11C-PiB SUVR and lateral ventricle 11C-PiB SUVR (A) and AUC35–80 (B) in Alzheimer disease (AD), mild cognitive impairment (MCI), and healthy controls (HC). In A, r = −0.479 and P = 0.162 for AD, r = −0.664 and P = 0.026 for MCI, and r = −0.909 and P < 0.001 for HC. In B, r = −0.182 and P = 0.614 for AD, r = −0.150 and P = 0.700 for MCI, and r = −0.115 and P = 0.751 for HC.

