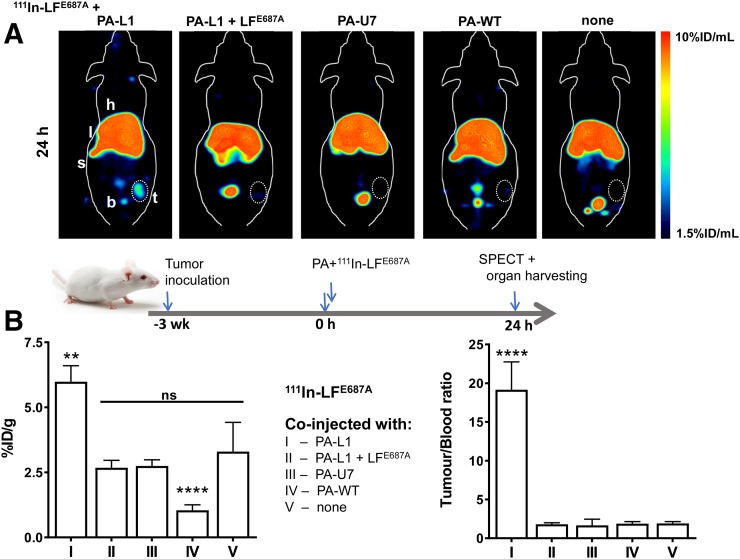
FIGURE 7.
(A) Representative coronal maximum-intensity projections of SPECT images of MDA-MB-231 tumor xenograft–bearing SCID mice, 24 h after administration of 111In-LFE687A, alone or in combination with (left to right) PA-L1, PA-L1 and excess of unlabeled LFE687A, PA-U7, PA-WT, or no PA protein. Tumors are encircled (B) Ex vivo biodistribution showing tumor uptake of 111In-LFE687A in different experimental groups. b = bladder; h = heart; l = liver; s = spleen; t = tumor. **P < 0.01. ****P < 0.0001.

