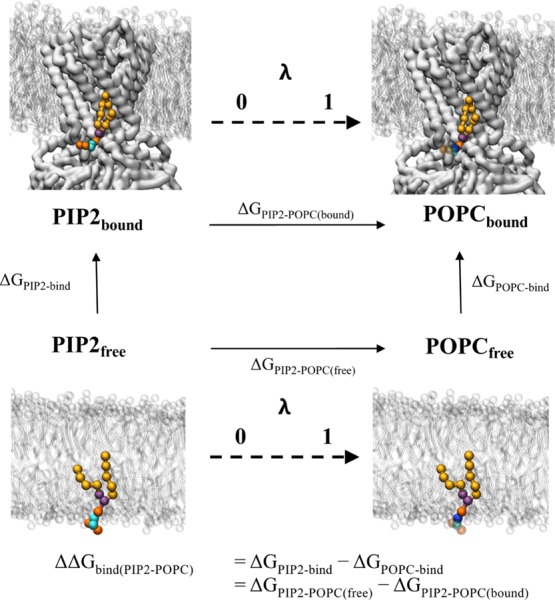
Figure 2.

Thermodynamic cycle for FEP shown is a representative thermodynamic cycle used for the FEP calculations in this study. The protein receptor (here Kir2.2) is shown as white surface, with the membrane as white sticks. The target lipid is shown as coloured spheres: on the left the native PIP2 molecule has lipid tails in yellow, glycerol beads in purple, phosphate beads in orange and sugar beads in cyan. On the right, the perturbed POPC lipid is coloured as PIP2, but with a blue choline bead, and transparent beads for the beads which have now been decoupled from the system. The horizontal vertices represent the two FEP calculations, where the target lipid is alchemically perturbed into the bulk lipid either free in membrane (ΔGPIP2–POPC(free)) or bound to the receptor (ΔGPIP2–POPC(bound)). These reactions are represented by a λ coordinate from 0 to 1. ΔΔGbind can be calculated as ΔGPIP2–POPC(free) – ΔGPIP2–POPC(bound), which will represent the same value as calculated in the PMF calculations (Figure 1). Note that the right vertical vertex (ΔGPOPC-bind) is the free energy required for the bulk lipid binding the receptor—in this special case of protein–lipid binding, where the ligand and the solvent are the same molecule, this value should be 0 kJ mol–1.
