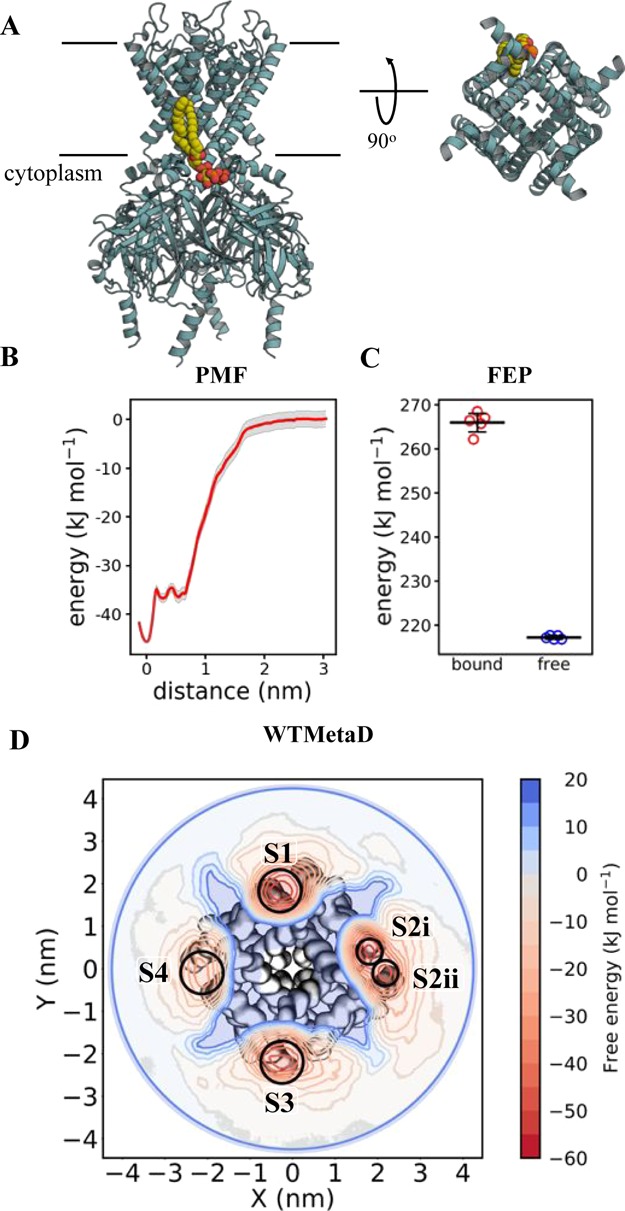
Figure 3.

Calculating Kir2.2–PIP2 binding energetics (A) view of Kir2.2 in cyan cartoon, with a bound PIP2 molecule in yellow, orange and red spheres, as sampled with CG MD. PIP2 interactions map to residues Arg 78, Arg 80, Lys 183, Arg 186, Lys 188, Lys 189 (Gallus gallus numbering). The approximate position of the membrane is shown with black lines. On the left is a view from the side, and on the right is a cytoplasmic view of the transmembrane region alone, with the intracellular domain removed for clarity. Note that only one PIP2 binding pose is shown, but four are present around the homotetrameric Kir2.2. (B) PMF data for Kir2.2–PIP2 binding. The y-axis is set to 0 for the bulk membrane, and the difference between this and the energy well (set to 0 nm on the x-axis) is ΔΔGbind, here −45 ± 2, with errors from 200 rounds of bootstrap analysis. (C) FEP data for Kir2.2–PIP2 binding, showing the energy cost for perturbing PIP2 to POPC whilst bound to Kir2.2 (red) and whilst free in a POPC membrane (blue). ΔΔGbind can be calculated from the free data minus the bound (see Figure 2), giving a value of −48 ± 2, with the error the standard deviation from five repeats. (D) 2D energy landscape for Kir2.2 and PIP2 as computed using WTMetaD. The protein is shown as surface behind the data, with the large intracellular domain removed for clarity. The energetic landscape for a PIP2 molecule around the protein has been computed and is shown as a red-blue contour map. Four binding regions in red can be seen around the protein, with reported ΔΔGbind values as follow: S1 = −55 ± 7, S2i = −49 ± 4, S2ii = −45 ± 5, S3 = −45 ± 6 and S4 = −36 ± 7 kJ mol–1.
