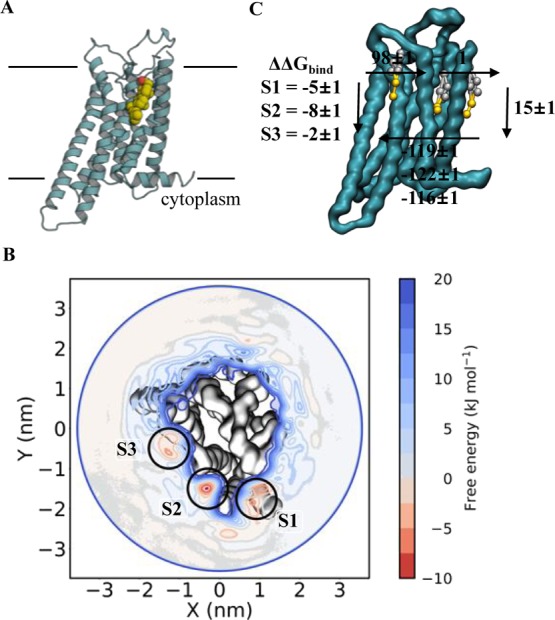
Figure 6.

Calculating A2AR–cholesterol binding energetics (A) view of A2AR bound to cholesterol, in one of several possible binding sites. Colours as in Figure 3A. (B) WTMetaD 2D energy landscape for A2AR and cholesterol, for the extracellular leaflet only. Three binding regions in red can be seen around the protein, reporting ΔΔGbind values as follow: S1 = −8 ± 3, S2 = −9 ± 3 and S3 = −5 ± 2 kJ mol–1. (C) ABFE analysis the sites from panel B. Here, the bound cholesterol is fully decoupled from a POPC membrane whilst bound to A2AR or whilst free in the membrane. The cycle represented here is a simplified version of the cycle in Supporting Figure 3. The final ΔΔGbind values are −5 ± 1, −8 ± 1 and −2 ± 1 kJ mol–1.
