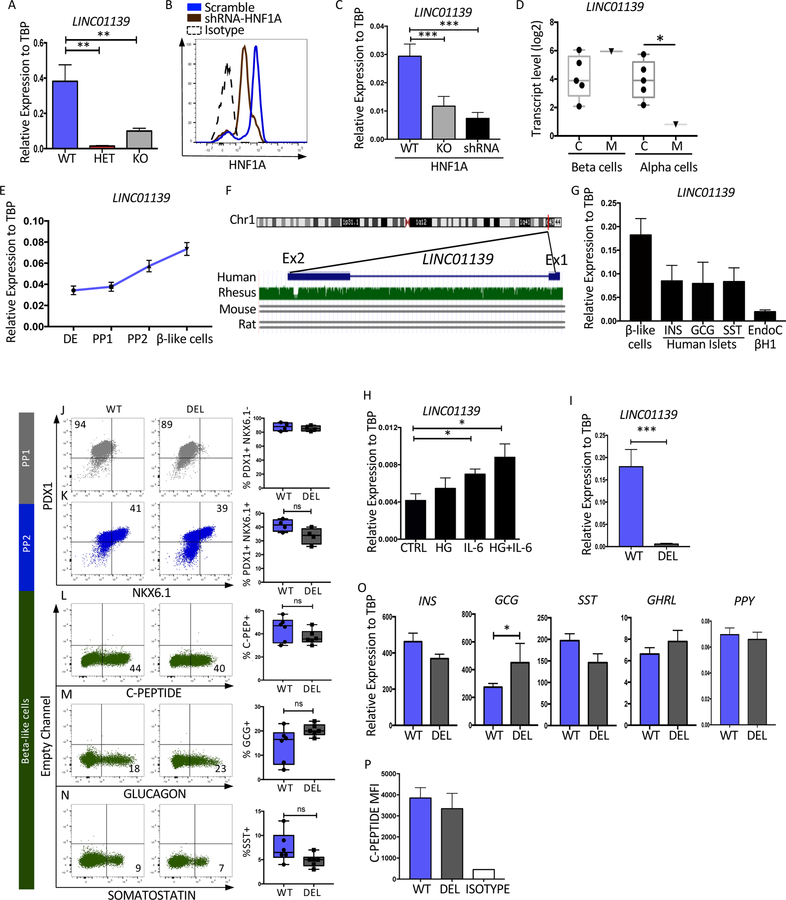
Figure 6: The human specific lncRNA, LINC01139 (LINKA), is a downstream target of HNF1A.
(A) qRT-PCR mRNA quantification of LINC01139 in HNF1A allelic series (Mel1), purified INS-GFP+ end stage beta-like cells (n=3 per sample).
(B–C) The EndoC-bH1 cell line was treated with or without HNF1A shRNA or CRISPR-CAS9 targeting HNF1A (KO) as described in Figure S5E (n=3 per sample). (B) Flow cytometry analysis of HNF1A in control or shRNA treated cells. (C) LINC01139 relative mRNA levels in WT, shRNA or KO cells.
(D) LINC01139 transcript levels in sorted beta cells and alpha cells from healthy pancreas donor controls referred to as C compared to cells from a single MODY3 mutant donor referred to as M (Haliyur et al 2019) (Control n=5, MODY3 n=1).
(E) Time-course LINC01139 mRNA quantification during pancreatic differentiation (n=3 per sample).
(F) LINC01139 gene homology, modified from UCSC genome browser comparing Human vs Rhesus, mouse and rat.
(G) LINC01139 mRNA quantification comparing purified stem cell derived beta-like cells with human islets sorted for INS, GCG, or SST and EndoC-bH1 cells (n=3 per sample).
(H) LINC01139 mRNA quantification in EndoC-bH1 cell line treated with different beta cell stressors: high glucose (HG)(100mM), Interleukin 6 (IL-6)(50ng/ul) or both (n=4 per sample).
(I) qRT-PCR quantification for LINC01139 mRNA in wild-type Mel1 line (WT) and deleted (DEL) LINC01139 cell line differentiated into end stage differentiation cultures.
(J–N) Pancreatic differentiation of LINC WT and LINC01139 DEL cell line with quantification of specific proteins by flow cytometry. (J) Quantification of PDX1+ cells at PP1 (n=4 per sample). (K) Quantification of PDX1+ NKX6.1+ cells at PP2 (n=4 per sample). (L) Quantification of C-peptide+ cells at end of the differentiation (n=6 per sample). (M) Quantification of glucagon+ cells at end of the differentiation (n=6 per sample). (N) Quantification of somatostatin+ cells at end of the differentiation (n=6 per sample).
(O) qRT-PCR mRNA quantification of pancreatic hormones INS, GCG, SST and GHRL at the end of the pancreatic differentiation (n=3 per sample).
(P) Quantification of C-Peptide Mean Fluorescence Intensity (MFI) at the end of the differentiation protocol (n=3 per sample).
For all statistical analysies: * P<0.05, **P<0.01, ***P<0.001. See also Figure S6.

