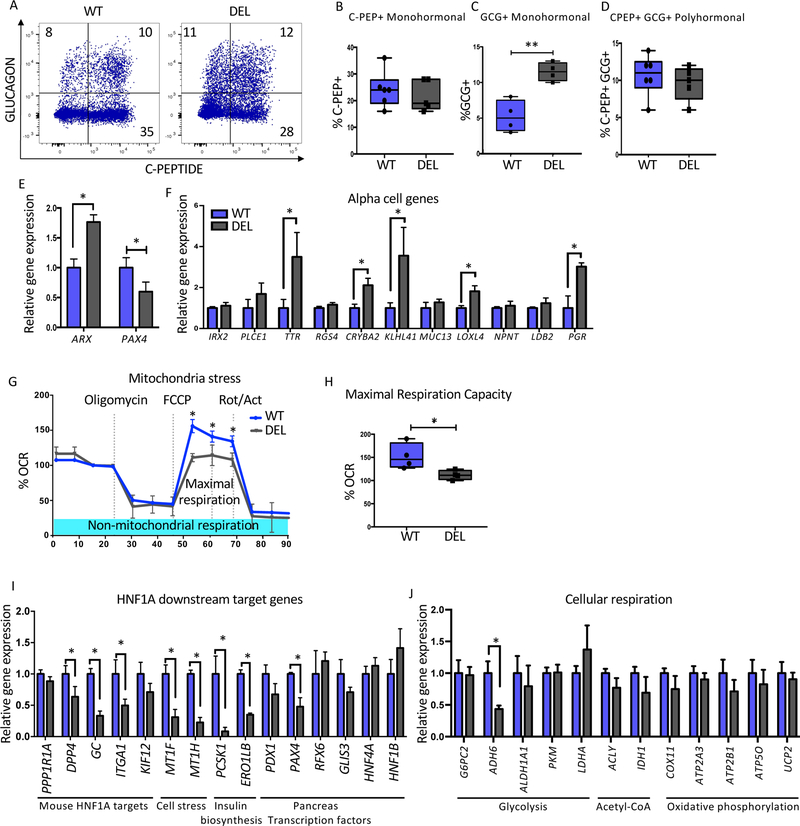
Figure 7: Lack of LINKA mimics a subset of the phenotypes found in HNF1A mutant cells.
Mel1 LINC01139 WT and deletion (DEL) ESCs were differentiated into pancreatic endocrine cells and analyzed as described below.
(A) Flow cytometry analysis of C-Peptide versus GLUCAGON at the end stage of pancreas differentiation (n=6 per WT and n=5 per LINC DEL cell line).
(B–D) Quantification of pancreatic hormone expressing cells. (B) Percent C-Peptide+ (C-PEP+) monohormonal cells. (C) Percent GLUCAGON+ (GCG+) monohormonal cells.
(D) Percent C-Peptide+ GLUCAGON+ (C-PEP+GCG+) cells.
(E) PAX4 and ARX mRNA expression at end of pancreatic differentiation in bulk cells (n=3 per sample).
(F) Relative gene expression of alpha cell specific genes at the end stage of differentiation in LINC01139 DEL and WT cell lines (n=3 per sample).
(G–H) Mitochondria stress test using oligomycin, FCCP and Rotenone/actinomycin (Rot/Act) in LINC01139 DEL and WT cell lines (n=3 per sample). (G) Mitochondrial respiration profile. (H) Quantification of maximal respiration capacity comparing WT and LINC01139 DEL cell lines (n=3 per genotype).
(I–J) mRNA quantification of HNF1A downstream target genes between WT and LINC01139 DEL cells using purified INS-GFP+ NKX6.1+ at end stage differentiation samples (n=3 per sample).
For all statistical analysis: * P<0.05. See also Figure S7.

