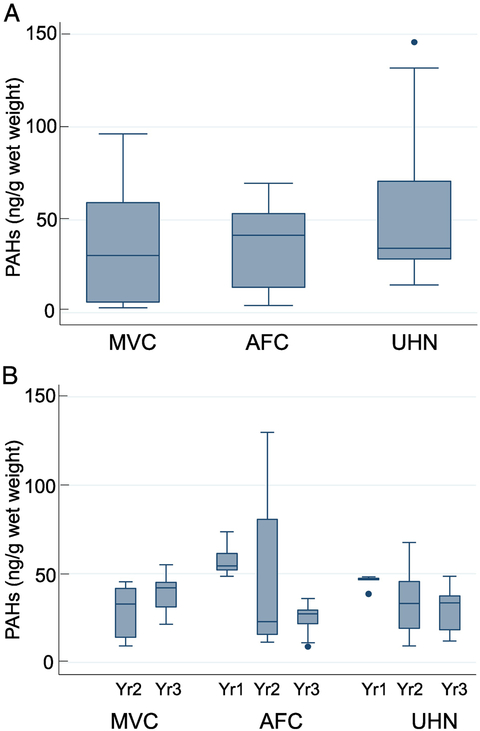
Figure 2.
PAH levels in white shrimp at various sites (Figure 2A) at different time intervals (Figure 2B). The method used for statistical analysis is described in the methods section. The error bars show the range (lowest to highest value) obtained. The lowest value is still within 25th percentile −1.5XIQR while the highest value is within the 75th percentile +1.5XIQR, and the horizontal line in the box represents the median value.

