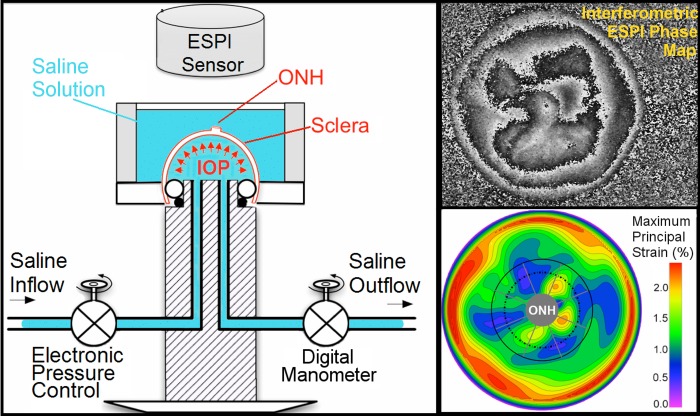
Figure 1.
Diagram of the inflation testing apparatus (left). Upper right: a typical correlation fringe pattern representing the laser waveform phase variation measured by the ESPI. Lower right: a typical maximum principal strain map of the outer surface of the posterior sclera, showing the boundary of the 15°-wide region surrounding the ONH that was assessed in this study. Note that a dashed line denotes the external boundary of the peripapillary region (∼2.2 mm wide) and the solid gray line denotes the external boundary of the midposterior region (defined such that it has the same surface area as peripapillary region). Figure reprinted with permission from Fazio et al.18

