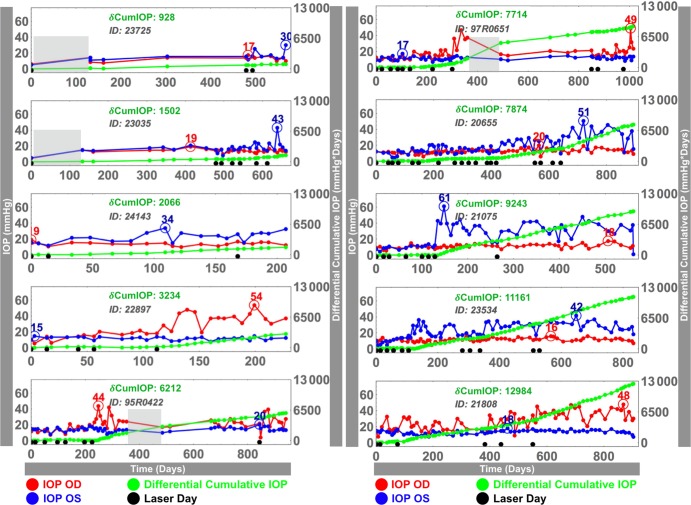
Figure 2.
Postlaser IOP histories in both eyes (blue, red) of the 10 chronic ocular hypertension NHPs in this study. For each animal, time 0 corresponds to the first laser session, and the last day is the date of euthanasia; note that time scales are different for each animal. Black dots along the x-axis signify each laser session. For each NHP, differential cumulative IOP (green curve in mm Hg·days; scale at right) was defined as the difference in area under the IOP versus time curve between the lasered and the normal eyes. Maximum detected IOP in each eye is shown with an open circle. Shaded gray area: August 30, 2005 to December 15, 2005; represents the period immediately after Hurricane Katrina, during which IOP could not be measured in some NHPs; see the Limitations section of the Discussion.

