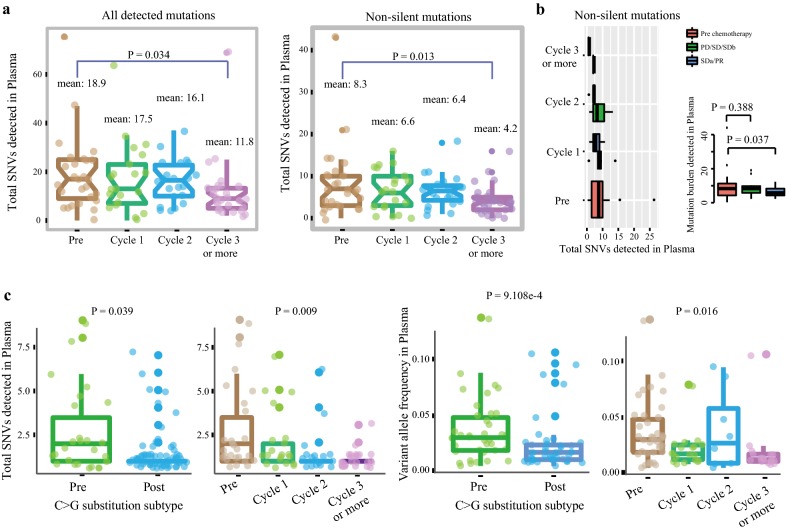
Fig. 2.
Total SNVs detected in plasma. a The distribution of all detected SNVs and non-silent mutations during platinum treatment was shown in the panel. The y-axis represented the mutation number. Each box represented each group and each dot was on behalf of one sample. b A comparison of non-silent mutations between platinum sensitive (SDa/PR) and platinum insensitive (PD/SD/SDb). The x-axis represented the mutation number detected in plasma and the y-axis represented the groups. c The distribution of C>G substitution subtype during chemotherapy. The y-axis represented the number of C>G substitution subtype in the two panel on the left with each dot representing one sample, whereas y-axis on behalf of the VAFs in the two panel on the right with each dot representing one mutation

