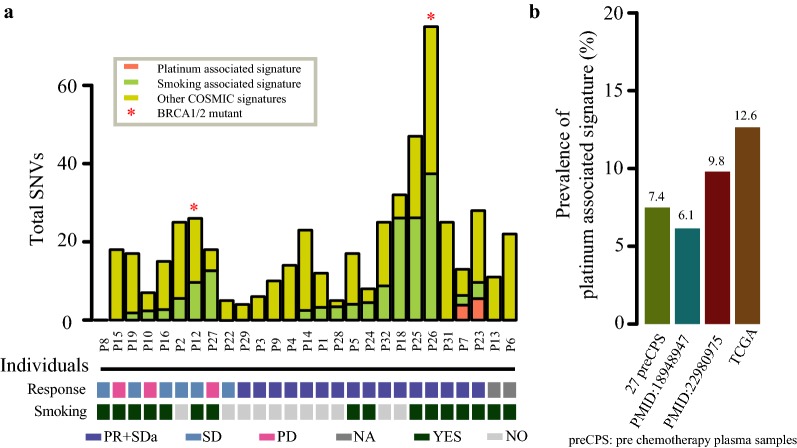
Fig. 3.
Signatures of mutational processes in 27 pre-chemotherapy plasma samples. Barplot showed the prevalence of platinum associated signature for four independent cohorts on the left. Total SNVs contributed to platinum associated signature (coral1) and smoking associated signature (darkolivegreen3) was shown in the panel on the right. Vertical axis represented the samples. *Represented BRCA1/2 mutant. Those samples with sensitive response were indicated in darkslateblue and smokers were indicated in darkslategrey

