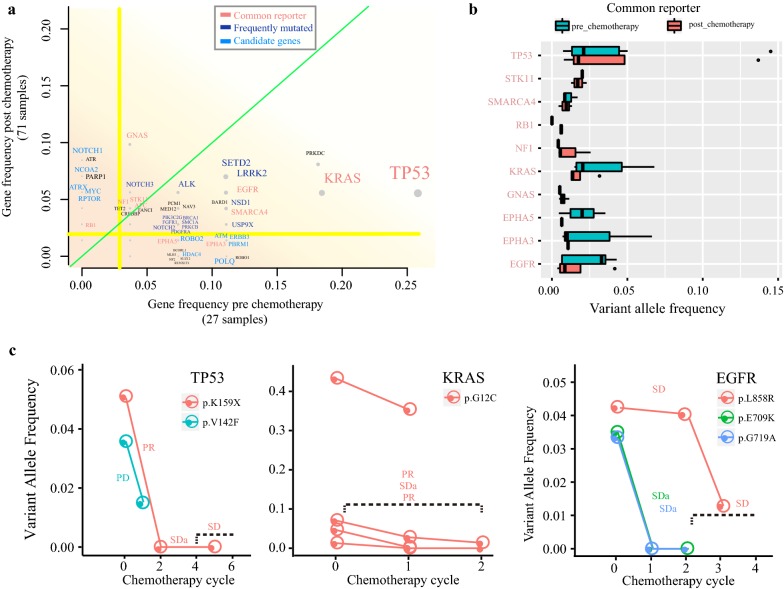
Fig. 4.
Mutant genes vary during platinum treatment. a Landscape of mutant genes during platinum-based chemotherapy. The y-axis represented the gene frequency post chemotherapy, whereas the x-axis represented the gene frequency pre chemotherapy. Each grey dot on behalf of one gene. Gene name with different color denoted its category. Light green line referred x-value equal to y-value. And the yellow lines showed the mean value of gene frequency. Plasma VAFs of common reporter during platinum-based chemotherapy were shown in b and c

