Fig. 6.
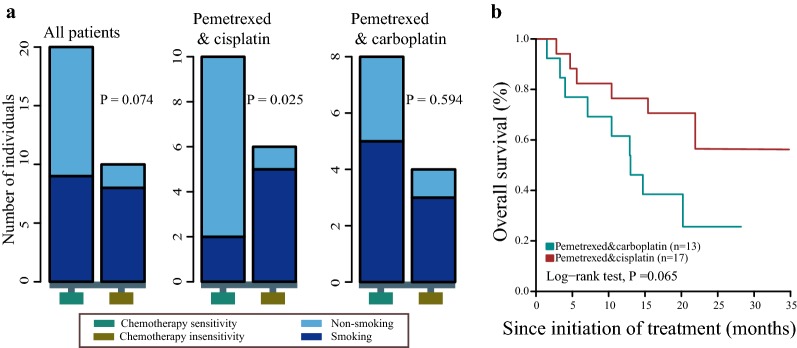
Smoking associated with chemotherapy response. a Relationships between smoking and chemotherapy response with different therapeutic plans were shown in the panel. The y-axis represented the number of patients. Vertical columns correspond to chemotherapy sensitivity (aquamarine4) and chemotherapy insensitivity (goldenrod4). b Overall survival analysis with different therapeutic regimens

