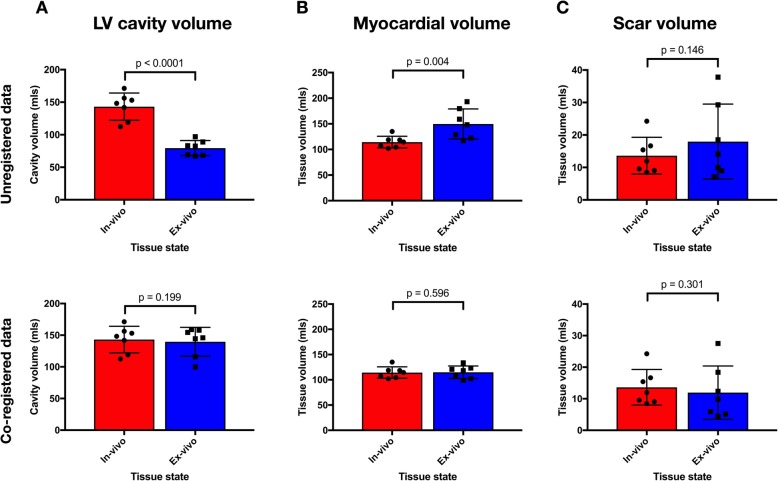
Fig. 5.
Comparison of tissue volumes between the in-vivo and ex-vivo state. Bars indicate mean volume of LV cavity (column a), myocardial tissue (column b) and scar (column c) segmented from in-vivo imaging (red) and ex-vivo imaging (blue), before (top row) and after (bottom row) completer two-step co-registration process. Individual data points are represented by circles (in-vivo) and squares (ex-vivo) and error bars show standard deviation. P values for ratio paired t-test are shown

