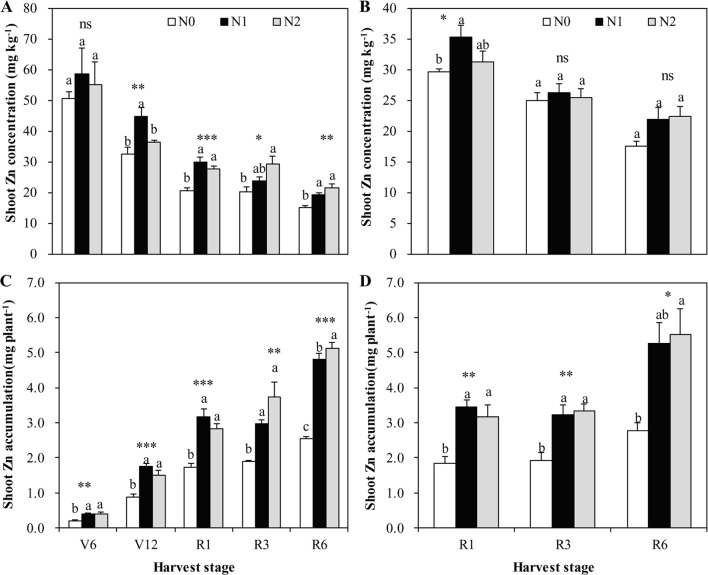
Figure 3.
The shoot Zn concentration and accumulation of summer maize at V6, V12, R1, R3, and R6 stages as affected by N application rates in 2009 (A, C) and 2010 (B, D), respectively, in the field. The bars represent the standard error of the mean (n = 4 in 2009 and n = 3 in 2010). For each stage, bars with same lowercase letters are not significantly different in different N treatments (P < 0.05). ns indicates no significant difference. *, **, and *** indicate significant difference at P < 0.05, < 0.01, and < 0.001, respectively.

