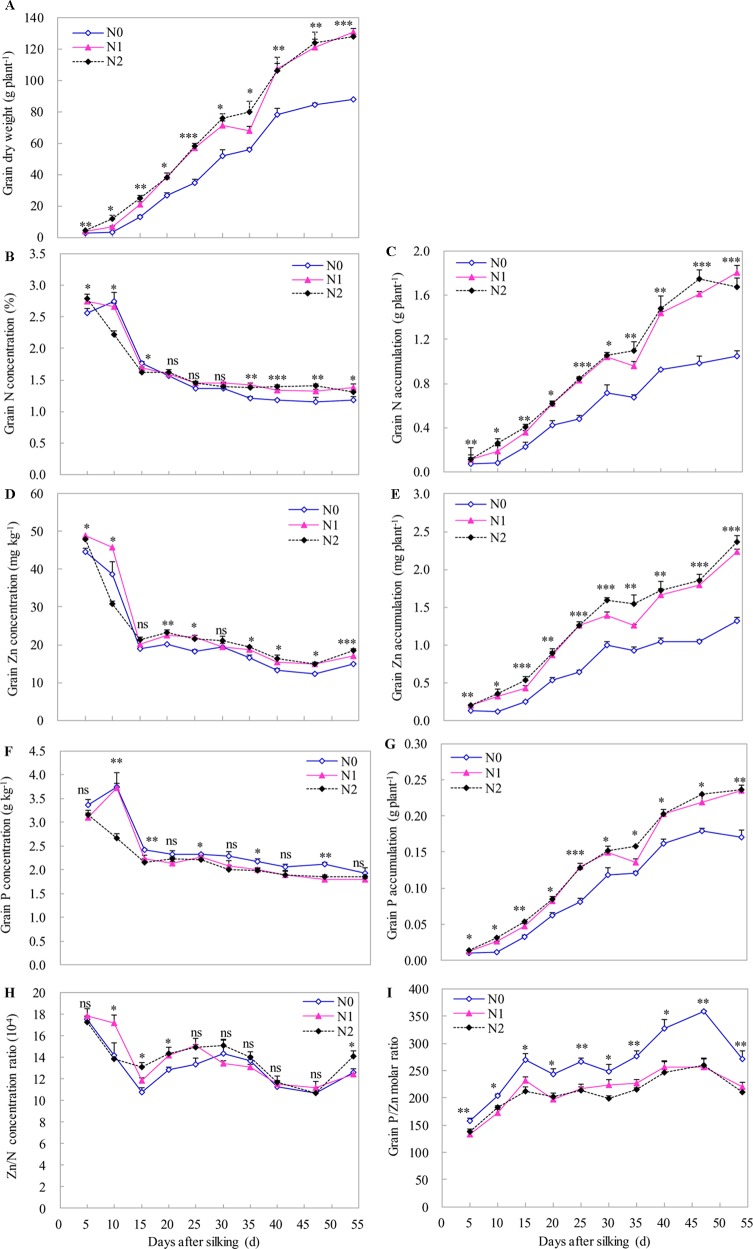
Figure 5.
The dynamics of grain dry weight (A), N, Zn and P concentration (B, D, F) and accumulation (C, E, G), the ratios of Zn to N accumulation (H) and the molar ratio of P to Zn (I) during the grain development in 2009. The error bars represent the standard error of the mean (n = 4). ns indicates no significant difference. *, **, and *** indicate significant difference at P < 0.05, < 0.01, and < 0.001, respectively.

